FIGURE 2.

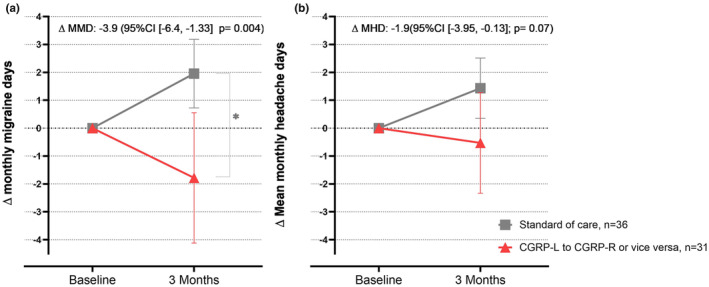
(a) ∆ Mean monthly migraine days and (b) ∆ mean monthly headache days with 95% CI from baseline and 3 months’ follow‐up in the switcher (n = 31) and control group (n = 36).

(a) ∆ Mean monthly migraine days and (b) ∆ mean monthly headache days with 95% CI from baseline and 3 months’ follow‐up in the switcher (n = 31) and control group (n = 36).