
FIGURE 3.
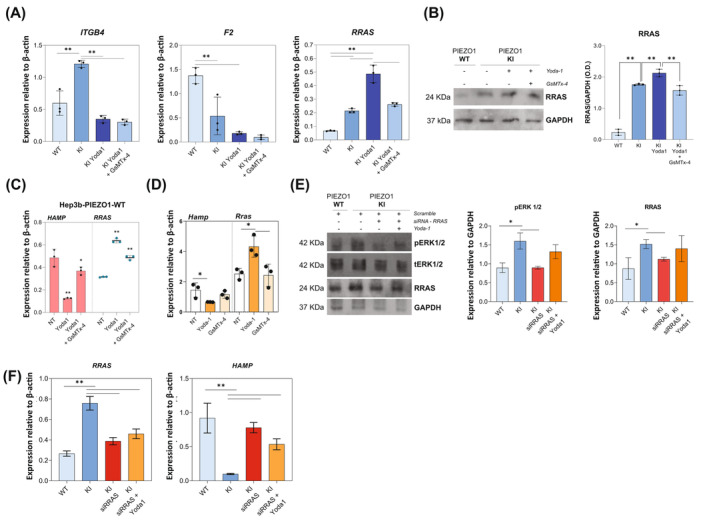
Crosstalk between RRAS deregulation and HAMP expression. (A) mRNA expression relative to β‐actin of ITGB4, F2, and RRAS, in PIEZO1‐WT and PIEZO1‐KI cells at steady state and PIEZO1‐KI treated with Yoda‐1 (15 μM for 60 min) or Yoda‐1 plus GsMTx‐4 (5 μM for 30 min) cells. (B) Left panel: Representative immunoblot of RRAS in PIEZO1‐WT and PIEZO1‐KI cells at steady state and PIEZO1‐KI treated with Yoda‐1 (15 μM for 60 min) or Yoda‐1 plus GsMTx‐4 (5 μM for 30 min) cells. Right panel: Quantification by densitometric analysis of three separate Western blots with similar results. Data are means ± standard deviation (SD) (**p < .01, ANOVA adjusted for Sidak's multiple comparisons test) and are normalized on GAPDH. (C) mRNA expression of HAMP (red histograms, left) and RRAS (blue scatter dot plot, right) in PIEZO1‐WT cells at steady state (NT) and treated with Yoda‐1 and GsMTx‐4. Data are means ± SD of three independent experiments. *p < .05, **p < .01 by ANOVA test and post hoc correction by Sidak's multiple comparison tests. (D) mRNA expression of Hamp and Rras in primary murine hepatocytes at steady state (NT), treated with Yoda‐1 (50 μM for 30 min) and Yoda‐1 plus GsMTx‐4 (30 μM for 30 min). Data are means ± SD of three independent experiments. *p < .05, by ANOVA test and post hoc correction by Sidak's multiple comparison tests. r‐value by Pearson correlation analysis of Hamp and Rras gene expression. (E) Left panel: Representative immunoblots of pERK1/2 and RRAS in total cells lysate of PIEZO1‐WT and PIEZO1‐KI cells treated with siRRAS and siRRAS + Yoda‐1 (15 μM for 60 min); tERK1/2 and GAPDH were used as loading control. Right panel: Histograms showing quantification by densitometric analysis of three separate western blots with similar results. Data are means ± SD (*p < .05, **p < .01, ANOVA test and post hoc correction by Sidak's multiple comparison tests). (F) Histograms showing HAMP and RRAS gene expression in PIEZO1‐WT and PIEZO1‐KI cells treated with siRRAS and siRRAS + Yoda‐1 (15 μM for 60 min). Data are means ± SD of three independent experiments (*p < .05, **p < .01, ANOVA test and post hoc correction by Sidak's multiple comparison tests). [Color figure can be viewed at wileyonlinelibrary.com]