
FIGURE 4.
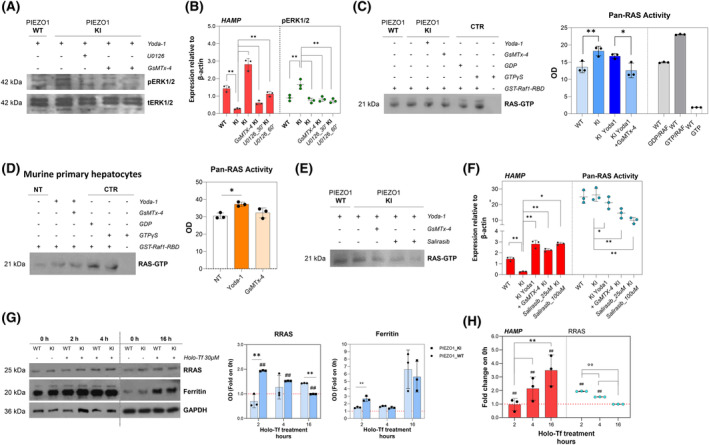
RRAS is a key regulator of PIEZO1‐mediated HAMP gene regulation, modulating MAPK cascade and RAS‐mediated signaling. (A) Representative immunoblots of pERK1/2 in total cells lysate of PIEZO1‐WT and PIEZO1‐KI cells treated with Yoda‐1 (15 μM for 60 min), PIEZO1‐KI treated with Yoda‐1 plus GsMTx‐4 (5 μM for 30 min) and PIEZO1‐KI treated with U0126 for 30 and 60 min. tERK1/2 was used as the loading control. (B) Histograms showing HAMP gene expression in PIEZO1‐WT and PIEZO1‐KI treated with Yoda‐1 (15 μM for 60 min), PIEZO1‐KI treated with Yoda‐1 plus GsMTx‐4 (5 μM for 30 min), and PIEZO1‐KI treated with U0126 for 30 and 60 min. Scatter dot plot showing quantification by densitometric analysis of three separate western blots with similar results. Data are means ± standard deviation (SD) of three independent experiments (*p < .05, **p < .01, ANOVA test and post hoc correction by Sidak's multiple comparison tests). (C) Left panel: Representative immunoblots of RAS GTP proteins purified by affinity precipitation with the RAS binding domain (RBD) of RAF1 from total cell lysate of PIEZO1‐WT and PIEZO1‐KI cells at steady state and PIEZO1‐KI treated with Yoda‐1 (15 μM for 60 min) or Yoda‐1 plus GsMTx‐4 (5 μM for 30 min). Lanes 5 and 6 are the positive controls (cell lysate treated with GST‐Raf1‐RBD plus GDP or GTP); lane 7 is the negative control (without GST‐Raf1‐RBD). Right panel: Quantification by densitometric analysis of three separate western blots with similar results. Data are means ± SD (*p < .05, PIEZO1‐WT vs. PIEZO1‐KI; **p < .01, PIEZO1‐KI vs. PIEZO1‐KI + GsMTx‐4; ANOVA test and post hoc correction by Sidak's multiple comparison tests). (D) Left panel: Representative immunoblots of RAS GTP proteins purified by affinity precipitation with the RBD of RAF1 from total cell lysate of primary murine hepatocytes (HCs) treated with vehicle, Yoda‐1 (50 μM for 30 min) or Yoda‐1 plus GsMTx‐4 (30 μM for 30 min). Lanes 5 and 6 are the positive controls (cell lysate treated with GST‐Raf1‐RBD plus GDP or GTP); lane 7 is the negative control (without GST‐Raf1‐RBD). Right panel: Histograms showing quantification by densitometric analysis of three separate western blots with similar results. Data are means ± SD (*p < .05, hepatocytes + Yoda‐1 vs. hepatocytes vehicle‐treated by ANOVA test and post hoc correction by Sidak's multiple comparison tests). (E) Left panel: Representative immunoblots of RAS GTP proteins purified by affinity precipitation with the RBD of RAF1 from total cell lysate of PIEZO1‐WT and PIEZO1‐KI cells at steady state and PIEZO1‐KI treated with Yoda‐1, Yoda‐1 plus GsMTx‐4 or Salirasib 25 and 100 μM. Right panel: Histograms showing HAMP gene expression in PIEZO1‐WT and PIEZO1‐KI treated with Yoda‐1 (15 μM for 60 min), PIEZO1‐KI treated with Yoda‐1 plus GsMTx‐4 and PIEZO1‐KI treated with Salirasib 25 and 100 μM. Boxes showing quantification by densitometric analysis of three separate Western blots with similar results. Data are means ± SD of three independent experiments. (*p < .05, PIEZO1‐WT vs. PIEZO1‐KI; **p < .01, PIEZO1‐KI vs. PIEZO1‐KI + GsMTx‐4; ANOVA test and post hoc correction by Sidak's multiple comparison tests). (G) Left panel: Representative immunoblots of RRAS, and ferritin in total cells lysate of PIEZO1‐WT and PIEZO1‐KI cells treated with Holo‐transferrin (Holo‐Tf) (30 μM) for 0, 2, 4, or 16 h. GAPDH is the loading control. Right panel: Quantification by densitometric analysis of three separate Western blots with similar results. Data are means ± SD (*p < .05, **p < .01 PIEZO1‐WT vs. PIEZO1‐KI; ##p < .01 PIEZO1‐KI 2, 4, or 6 vs. PIEZO1‐KI NT [0 h]; ##p < .01 PIEZO1‐KI vs. PIEZO1‐WT. ANOVA test and post hoc correction by Sidak's multiple comparison tests). (H) Histograms showing HAMP gene expression normalized to β‐actin (red), and scatter dot plot showing quantification of and RRAS protein expression in PIEZO1‐KI cells treated with Holo‐Tf (30 μM) for 2, 4, or 16 h. Data are means ± SD of three independent experiments and are represented as fold on NT (##p < .01 vs. NT (0 h);°°p < .01, PIEZO1‐KI 2 h vs. PIEZO1‐KI 4 h, PIEZO1‐KI 4 h vs. PIEZO1‐KI 16 h ANOVA and PIEZO1‐KI 2 h vs. PIEZO1‐KI 16 h by ANOVA test and post hoc correction by Sidak's for multiple comparisons). OD, optical density. [Color figure can be viewed at wileyonlinelibrary.com]