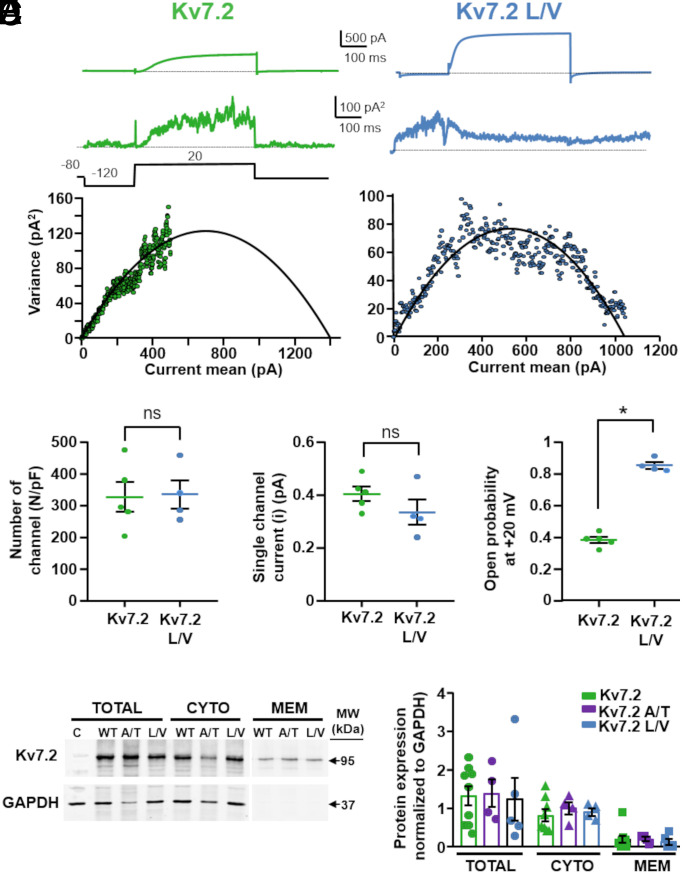
Fig. 2.
Nonstationary noise analysis of K+ currents from Kv7.2 channels carrying variants in the pore AG. (A) Representative average response to 100 pulses at +20 mV (Top traces), variance (Middle traces), and variance versus current mean plot (Bottom traces) for Kv7.2 and Kv7.2 L318V, as indicated. The continuous lines in the variance/mean plots are the parabolic fits of the experimental data to equation 2 in the Methods section. (B–D) Quantification of the number of channels divided by the capacitance (b), the single-channel current (c), and the opening probability at 20 mV (d) for the indicated channels. * = P < 0.05. (E) Representative western blot image of total, cytosolic, or plasma membrane protein fractions from CHO cells transfected with pcDNA3.1 (empty vector, C), Kv7.2 (WT), Kv7.2 A317T (A/T), or Kv7.2 L318V (L/V) subunits. On the right, the positions of the estimated molecular masses of the Kv7.2 (95 kDa) and GAPDH (37 kDa) bands are shown. (F) Densitometric quantification of the 95 kDa band intensity in the indicated experimental groups. The data are expressed as the means ± SEMs.

