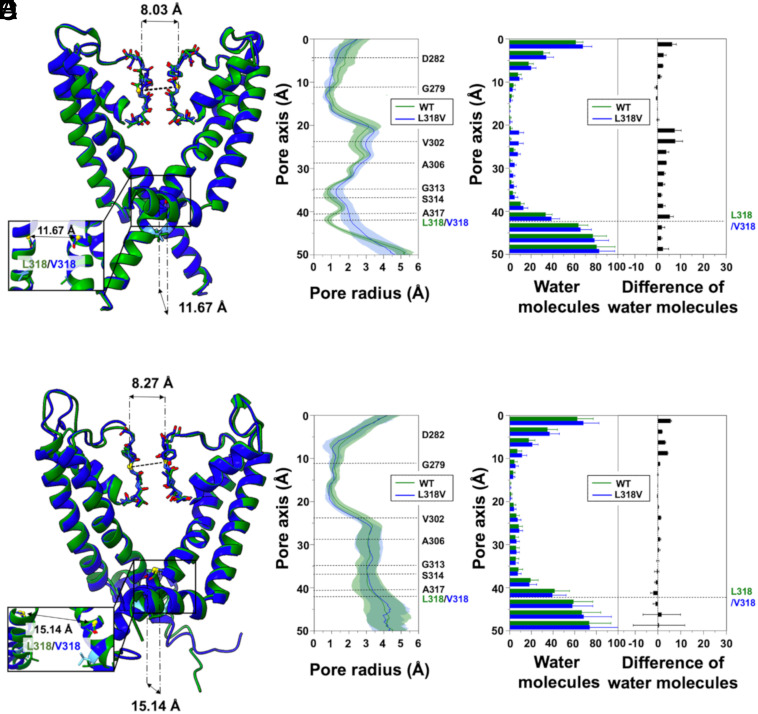
Fig. 6.
MD simulations of the L318V Kv7.2 variant. (A) Superposition of WT (green) and L318V (blue) representative Kv7.2 closed structures after equilibration and before MD production simulations. (B) Channel radius profiles along the pore axis of the two proteins averaged over all the simulated replicas. Shaded regions indicate SD. (C) Distribution of water molecules along the channel axis. Averages and SD were calculated for all replicates. (D–F) Same as (A–C) but for the open structures.

