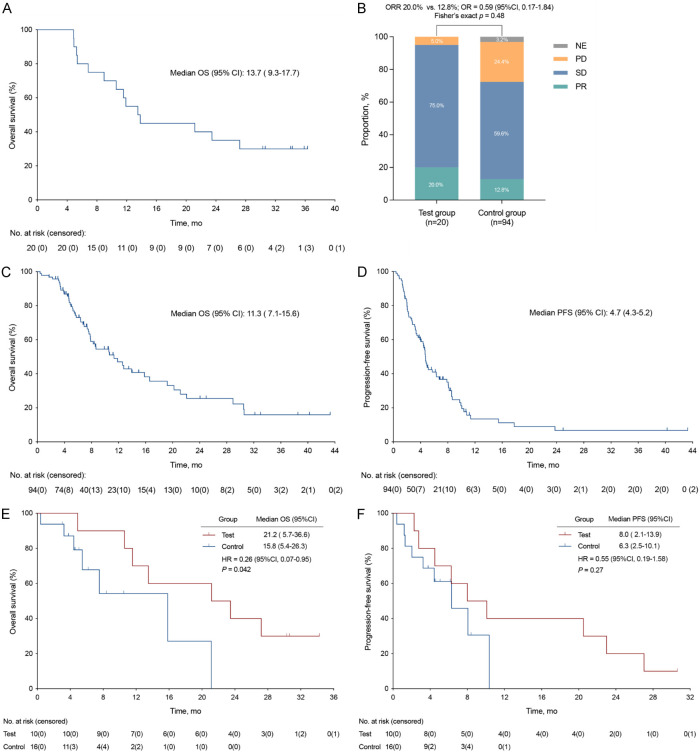
Figure 2.
Kaplan-Meier curve and tumor response. A. Overall survival of study patients. B. Tumor response in test and control group patients. C, D. Overall survival and progression-free survival of control patients in real world. E, F. Overall survival and progression-free survival of matched patients after propensity score matching. CI, confidence interval; HR, hazard ratio; NE, not evaluable; OR, odds ratio; ORR, objective response rate; OS, overall survival; PD, progressive disease; PFS, progression-free survival; PR, partial response; SD, stable disease.

