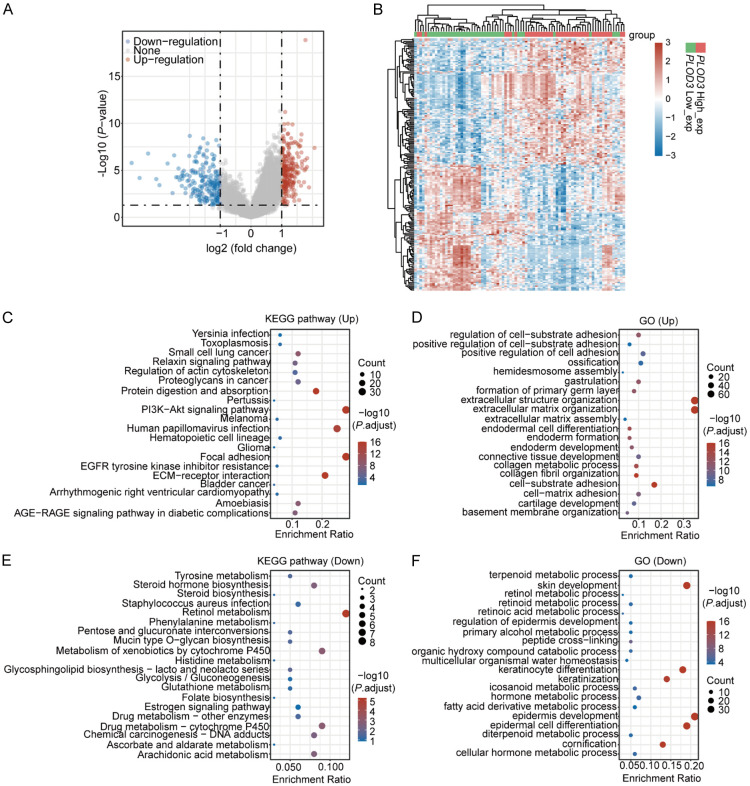
Figure 4.
Identification of DEGs associated with PLOD3 differential expression. (A) Volcano Plot of DEGs in the PLOD3-high vs. PLOD3-low group comparison. (B) Heatmap showing the differential genes in PLOD3-high vs. PLOD3-low. (C-F) KEGG (C, E) and GO (D, F) analysis of up-regulated and down-regulated differentially expressed genes.

