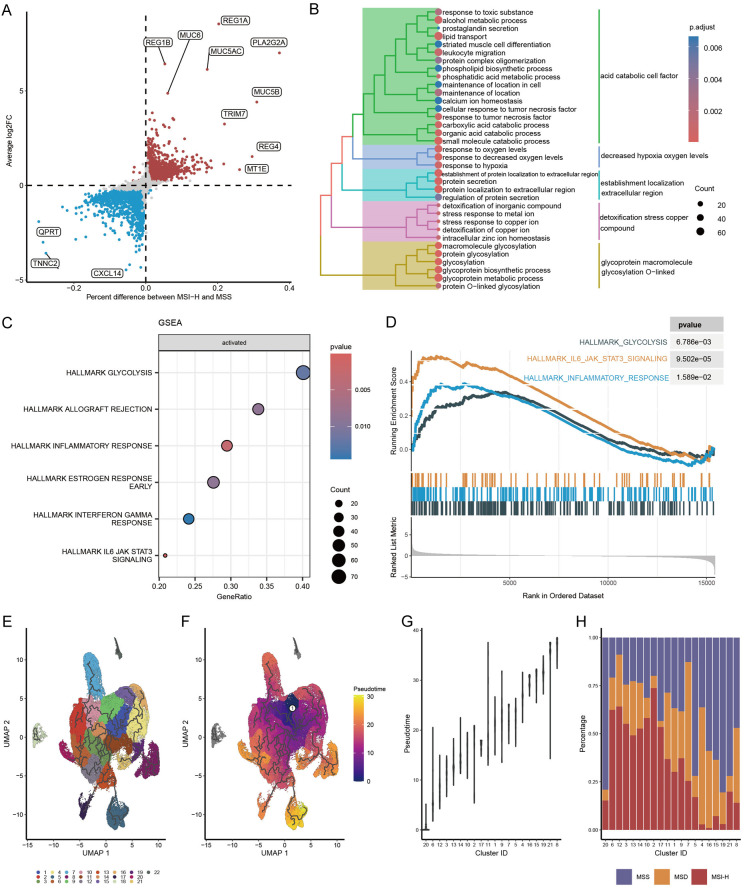
Figure 3.
DEGs, signaling pathway activity, and evolutionary trajectory of MSI-H cells. A. DEGs between MSI-H and MSS cells. B. Enriched GO items of DEGs in MSI-H cells. C. Enriched hallmark pathways in MSI-H cells using GSEA. D. Running score and preranked list of three hallmark pathways visualized by GSEA plot. E. Graph-based clustering of scCRC tumor cells. F. Trajectory and pseudotime analysis of scCRC tumor cells. The black lines show the structure of the trajectory graph. White circle denotes the initial time point. G. Ordering clusters by evolutionary pseudotime. H. Percentage of MSI-H, MSS, and MSD cells in clusters ordered by pseudotime.

