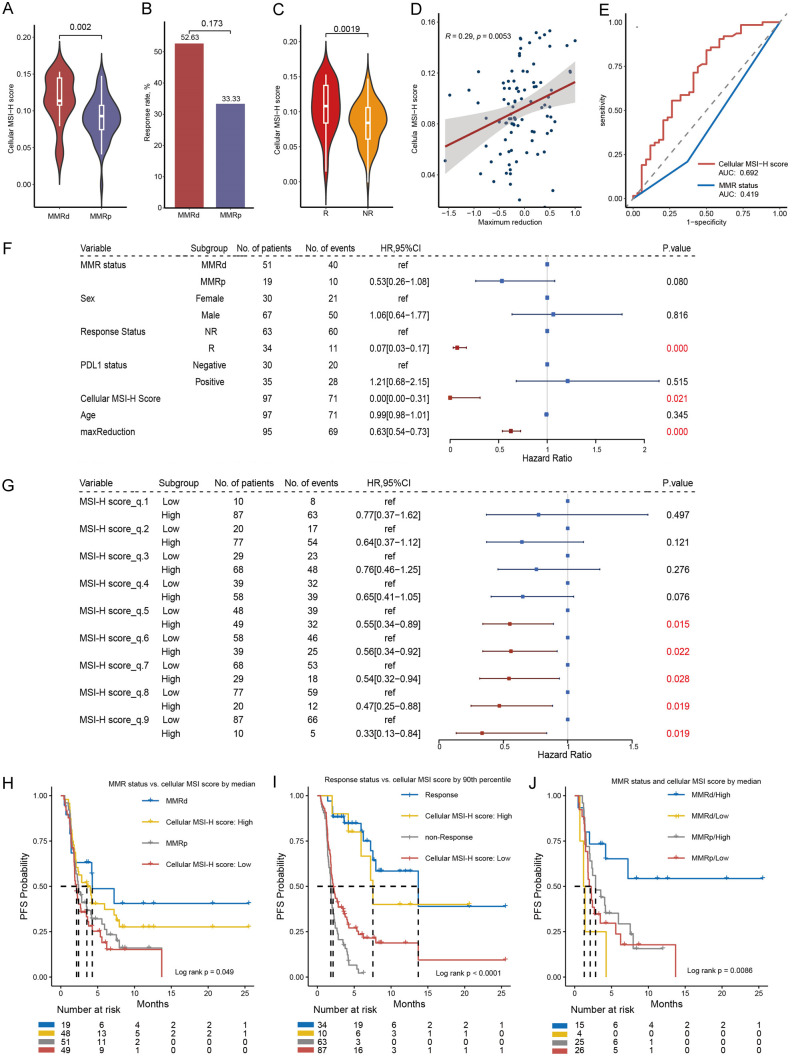
Figure 5.
Correlation between cellular MSI-H score and immunotherapy response and PFS in the BJ-cohort. A. Comparison of cellular MSI-H score between MMRd and MMRp samples. B. Response rate comparison between molecular MMRd and MMRp patients. C. Density distribution of cellular MSI-H score between response and non-response patients. D. Correlation between cellular MSI-H score and tumor maximum regression. E. Predicting response status using cellular MSI-H score and MMR status by ROC curve. F. Univariate-cox survival analysis against PFS. G. Categorizing the BJ-cohort into high and low cellular MSI-H score groups using each decile of cellular MSI-H score as a threshold and compare the PFS between groups. H. Kaplan-meier (KM) analysis between groups defined by MMR status, and by median value of cellular MSI-H score. I. KM analysis between groups defined by response status, and by upper decile value of cellular MSI-H score. J. KM curve by combining MMR status and cellular MSI-H score discretized by median.

