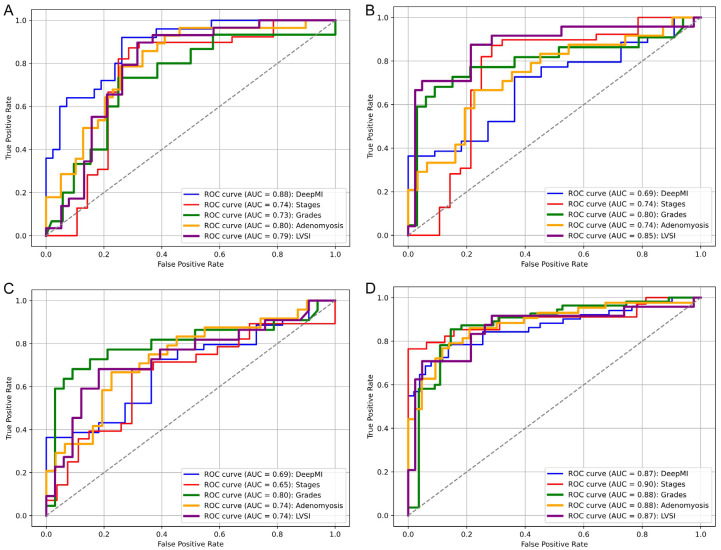
Figure 4.
The ROC curves for classifying deep myometrial invasion, International Federation of Gynecology and Obstetrics stage, high-grade tumors, adenomyosis status, and lymphovascular space invasion for each model: (A) The sagittal CE-T1WI model, (B) The sagittal T2WI model, (C) The sagittal DWI model, and (D) The combined model. ROC receiver operating characteristic, AUC area under the ROC curve.

