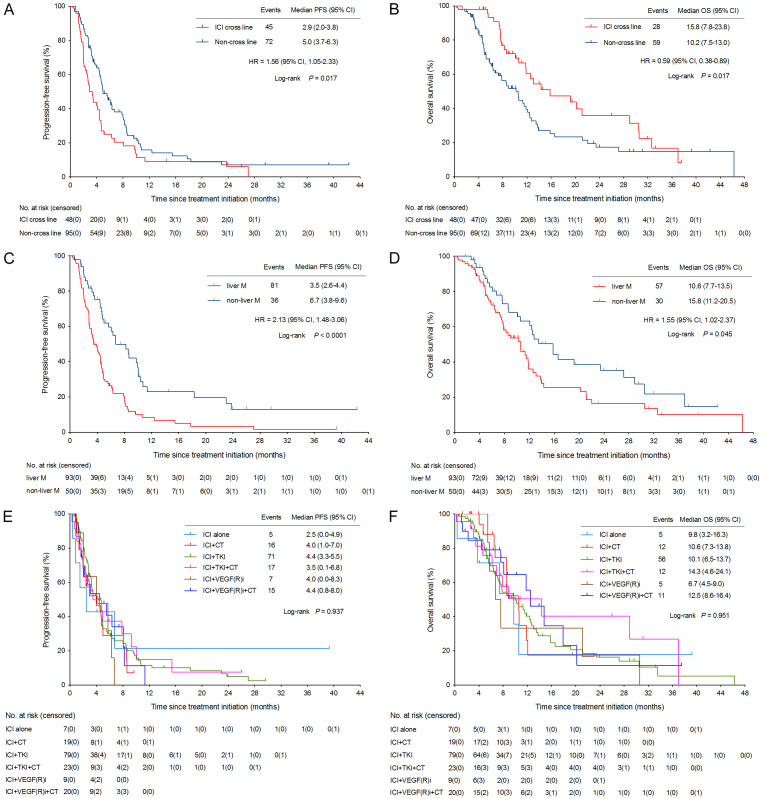
Figure 4.
Kaplan-Meier curves of PFS and OS in subgroup analysis. CI, confidence interval; HR, hazard ratio; CT, chemotherapy; ICI, immune checkpoint inhibitor; OS, overall survival; PFS, progression-free survival; TKI, tyrosine kinase inhibitor; VEGF(R)i, vascular endothelial growth factor (receptor) inhibitor.

