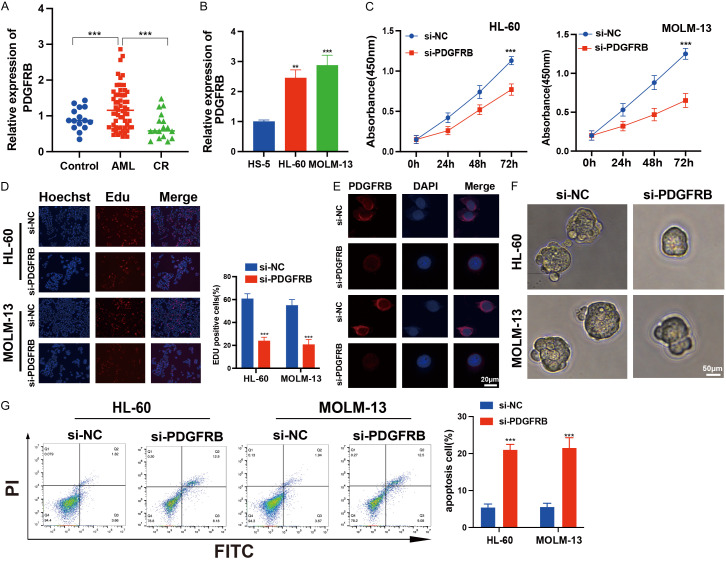
Figure 8.
Impact of PDGFRB knockdown on AML cell functions. A. Expression analysis of PDGFRB in patients with AML, healthy donors (Control), and patients in complete remission (CR). B. qRT-qPCR analysis of PDGFRB in HL-60 and MOLM-13 cells, as well as HS-5 cells. C. Cell proliferation analysis of AML cells with PDGFRB knockdown. D. Decreased percentage of EdU-positive cells after PDGFRB knockdown in AML cells. E. FISH assay confirming the localization of PDGFRB knockdown in the cytoplasm. Scale bar: 20 μm. F. Images of HL-60 and MOLM-13 cells after PDGFRB knockdown for 7 days. Scale bar: 50 μm. G. Flow cytometry revealing cell apoptosis of HL-60 and MOLM-13 cells after 24 h. The data represent the mean ± standard deviation from three independent experiments. **P < 0.01, ***P < 0.001.

