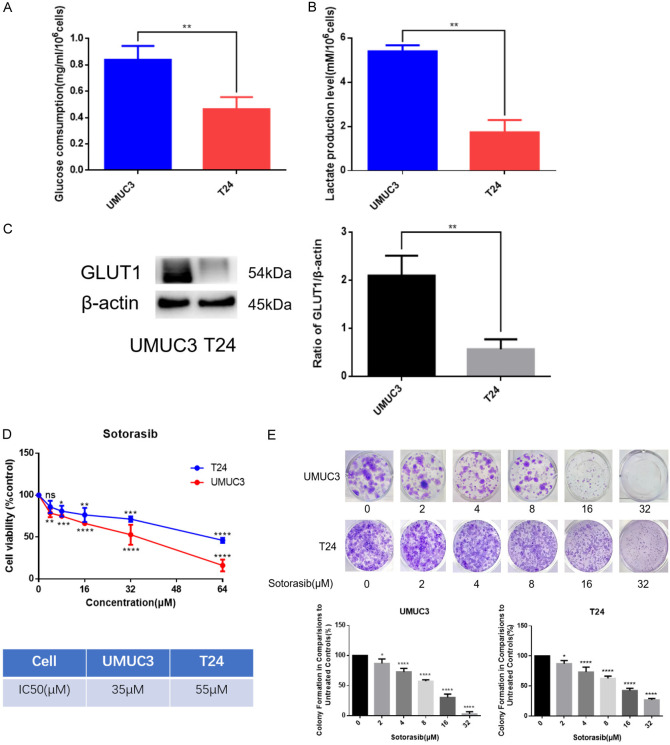
Figure 2.
Comparison on the glucose metabolism and the sensitivity to Sotorasib of KRASG12C mutant and wild-type bladder cancer cells. (A) When UMUC3 and T24 density reached 60%-70%, the supernatant and cell lysate were collected. Cells were counted before lysed. After 24 h, the supernatant and cell lysate were collected. Then glucose consumption was detected by glucose detection kit. (B) Steps before detection were the same as those for (A). Then lactate production was detected by lactate detection kit. (C) Expression of GLUT1 in UMUC3 and T24 was detected by WB. (D) Inhibitory effects of Sotorasib on the proliferation of UMUC3 and T24 were detected by MTT assay. IC50 values were counted by SPSS 20.0. (E) Inhibitory effects of Sotorasib on the proliferation of UMUC3 and T24 were detected by colony formation assay (*P < 0.05, **P < 0.01, ***P < 0.001, ****P < 0.0001, ns not significant, n=3).

