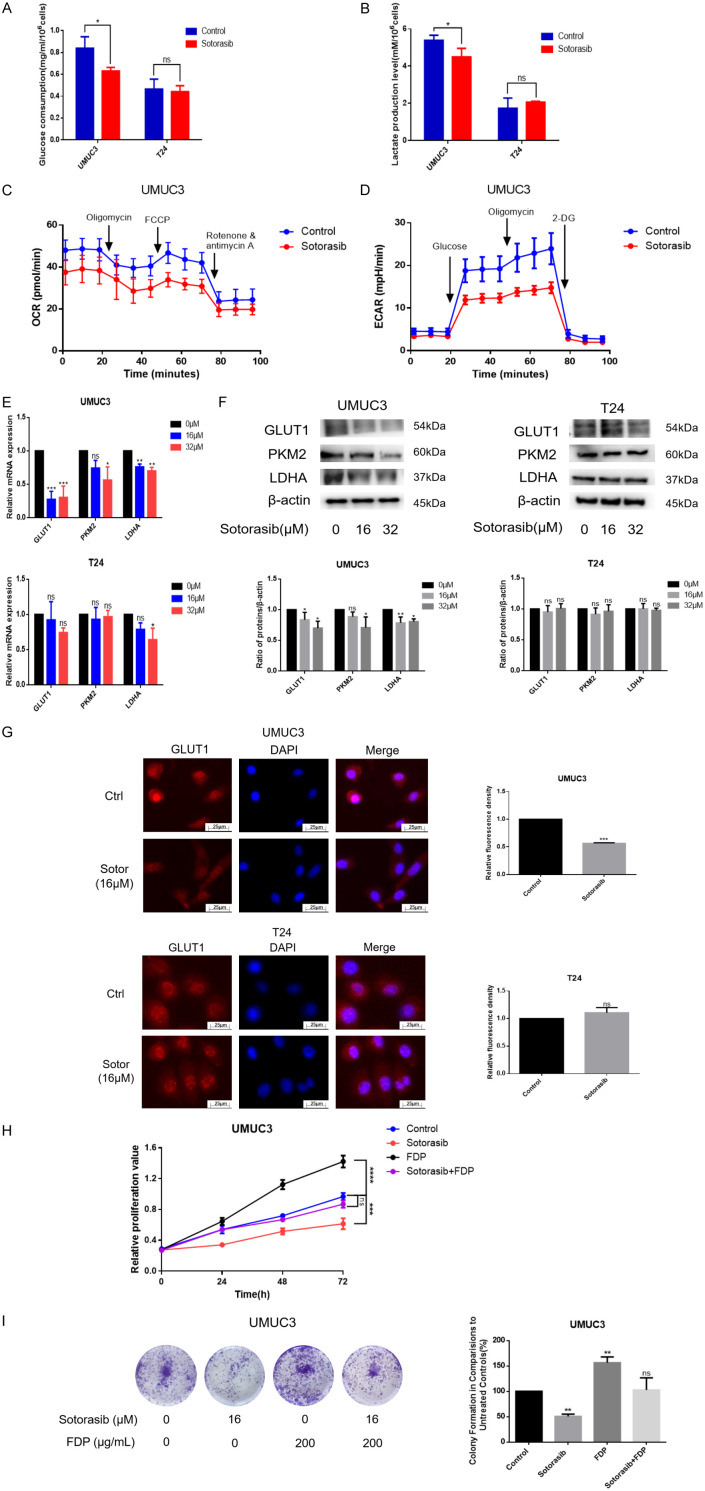
Figure 3.
Impact of Sotorasib on glucose metabolism in KRASG12C mutant bladder cancer cells. (A) Glucose consumption was measured using a glucose detection kit. (B) The steps before detection were the same as (A), then lactate production was detected with a lactate detection kit. (C) UMUC3 with or without Sotorasib treatment (16 μM), were analyzed for oxygen consumption rate via Seahorse assay. (D) The extracellular acidification rate was examined using the same assay. (E and F) UMUC3 and T24 were treated with various concentrations of Sotorasib (0, 16, and 32 μM) for 12 h and underwent mRNA and protein expression analyses of GLUT1, PKM2, and LDHA by qRT-PCR and WB, respectively. (G) The expression of GLUT1 in treated or untreated UMUC3 and T24 was detected by immunofluorescence. (H and I) The proliferation of UMUC3 treated with Sotorasib (16 μM) or FDP (200 μg/mL) was monitored using MTT and colony formation assays, respectively (*P < 0.05, **P < 0.01, ***P < 0.001, ****P < 0.0001, ns not significant, n=3).

