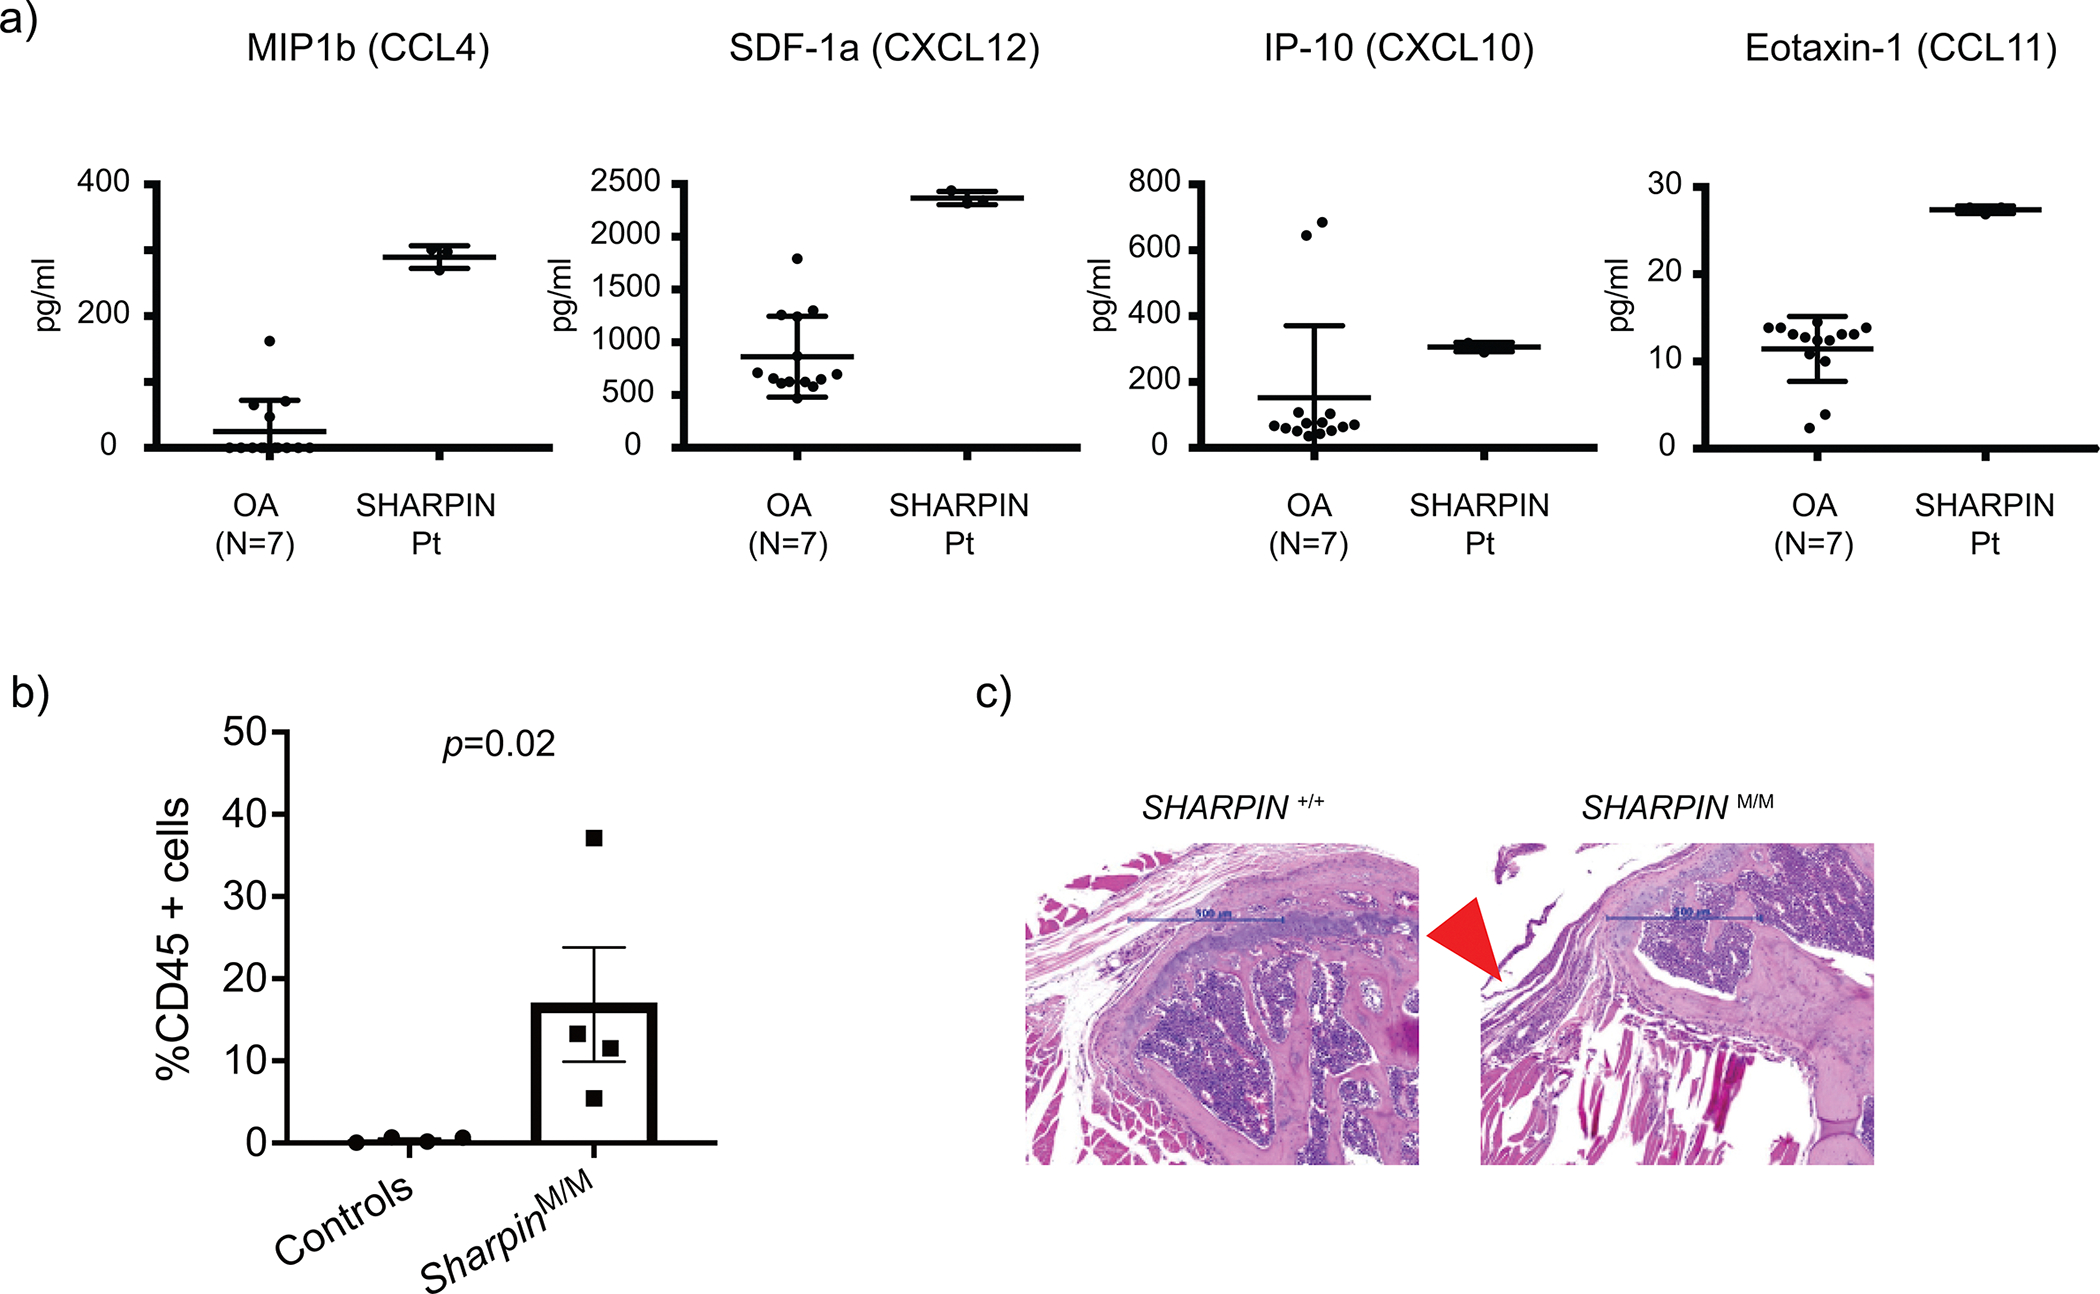
Extended Data Figure 5: Characterization of joint inflammation in SHARPIN deficiency.

(a) Multiplex ELISA measurement of chemokines in the sterile synovial fluid from P1 before the initiation of anti-TNF treatment and osteoarthritis (OA) control donors (N=7). The samples were measured in technical triplicate (P1) or duplicate (OA), respectively. Mean values ± s.d are displayed. (b) Quantification of CD45 positive cells in tendons of shoulder joints of control and Sharpin-deficient mice (n=4 for each group). Statistical method? Data are represented as mean values + SEM. (c) Representative hematoxylin and eosin (H&E) staining sections of elbow joints from Sharpin-deficient mice (N=) and wild type littermate control (N= _. Arrowhead indicates inflamed ligament.
