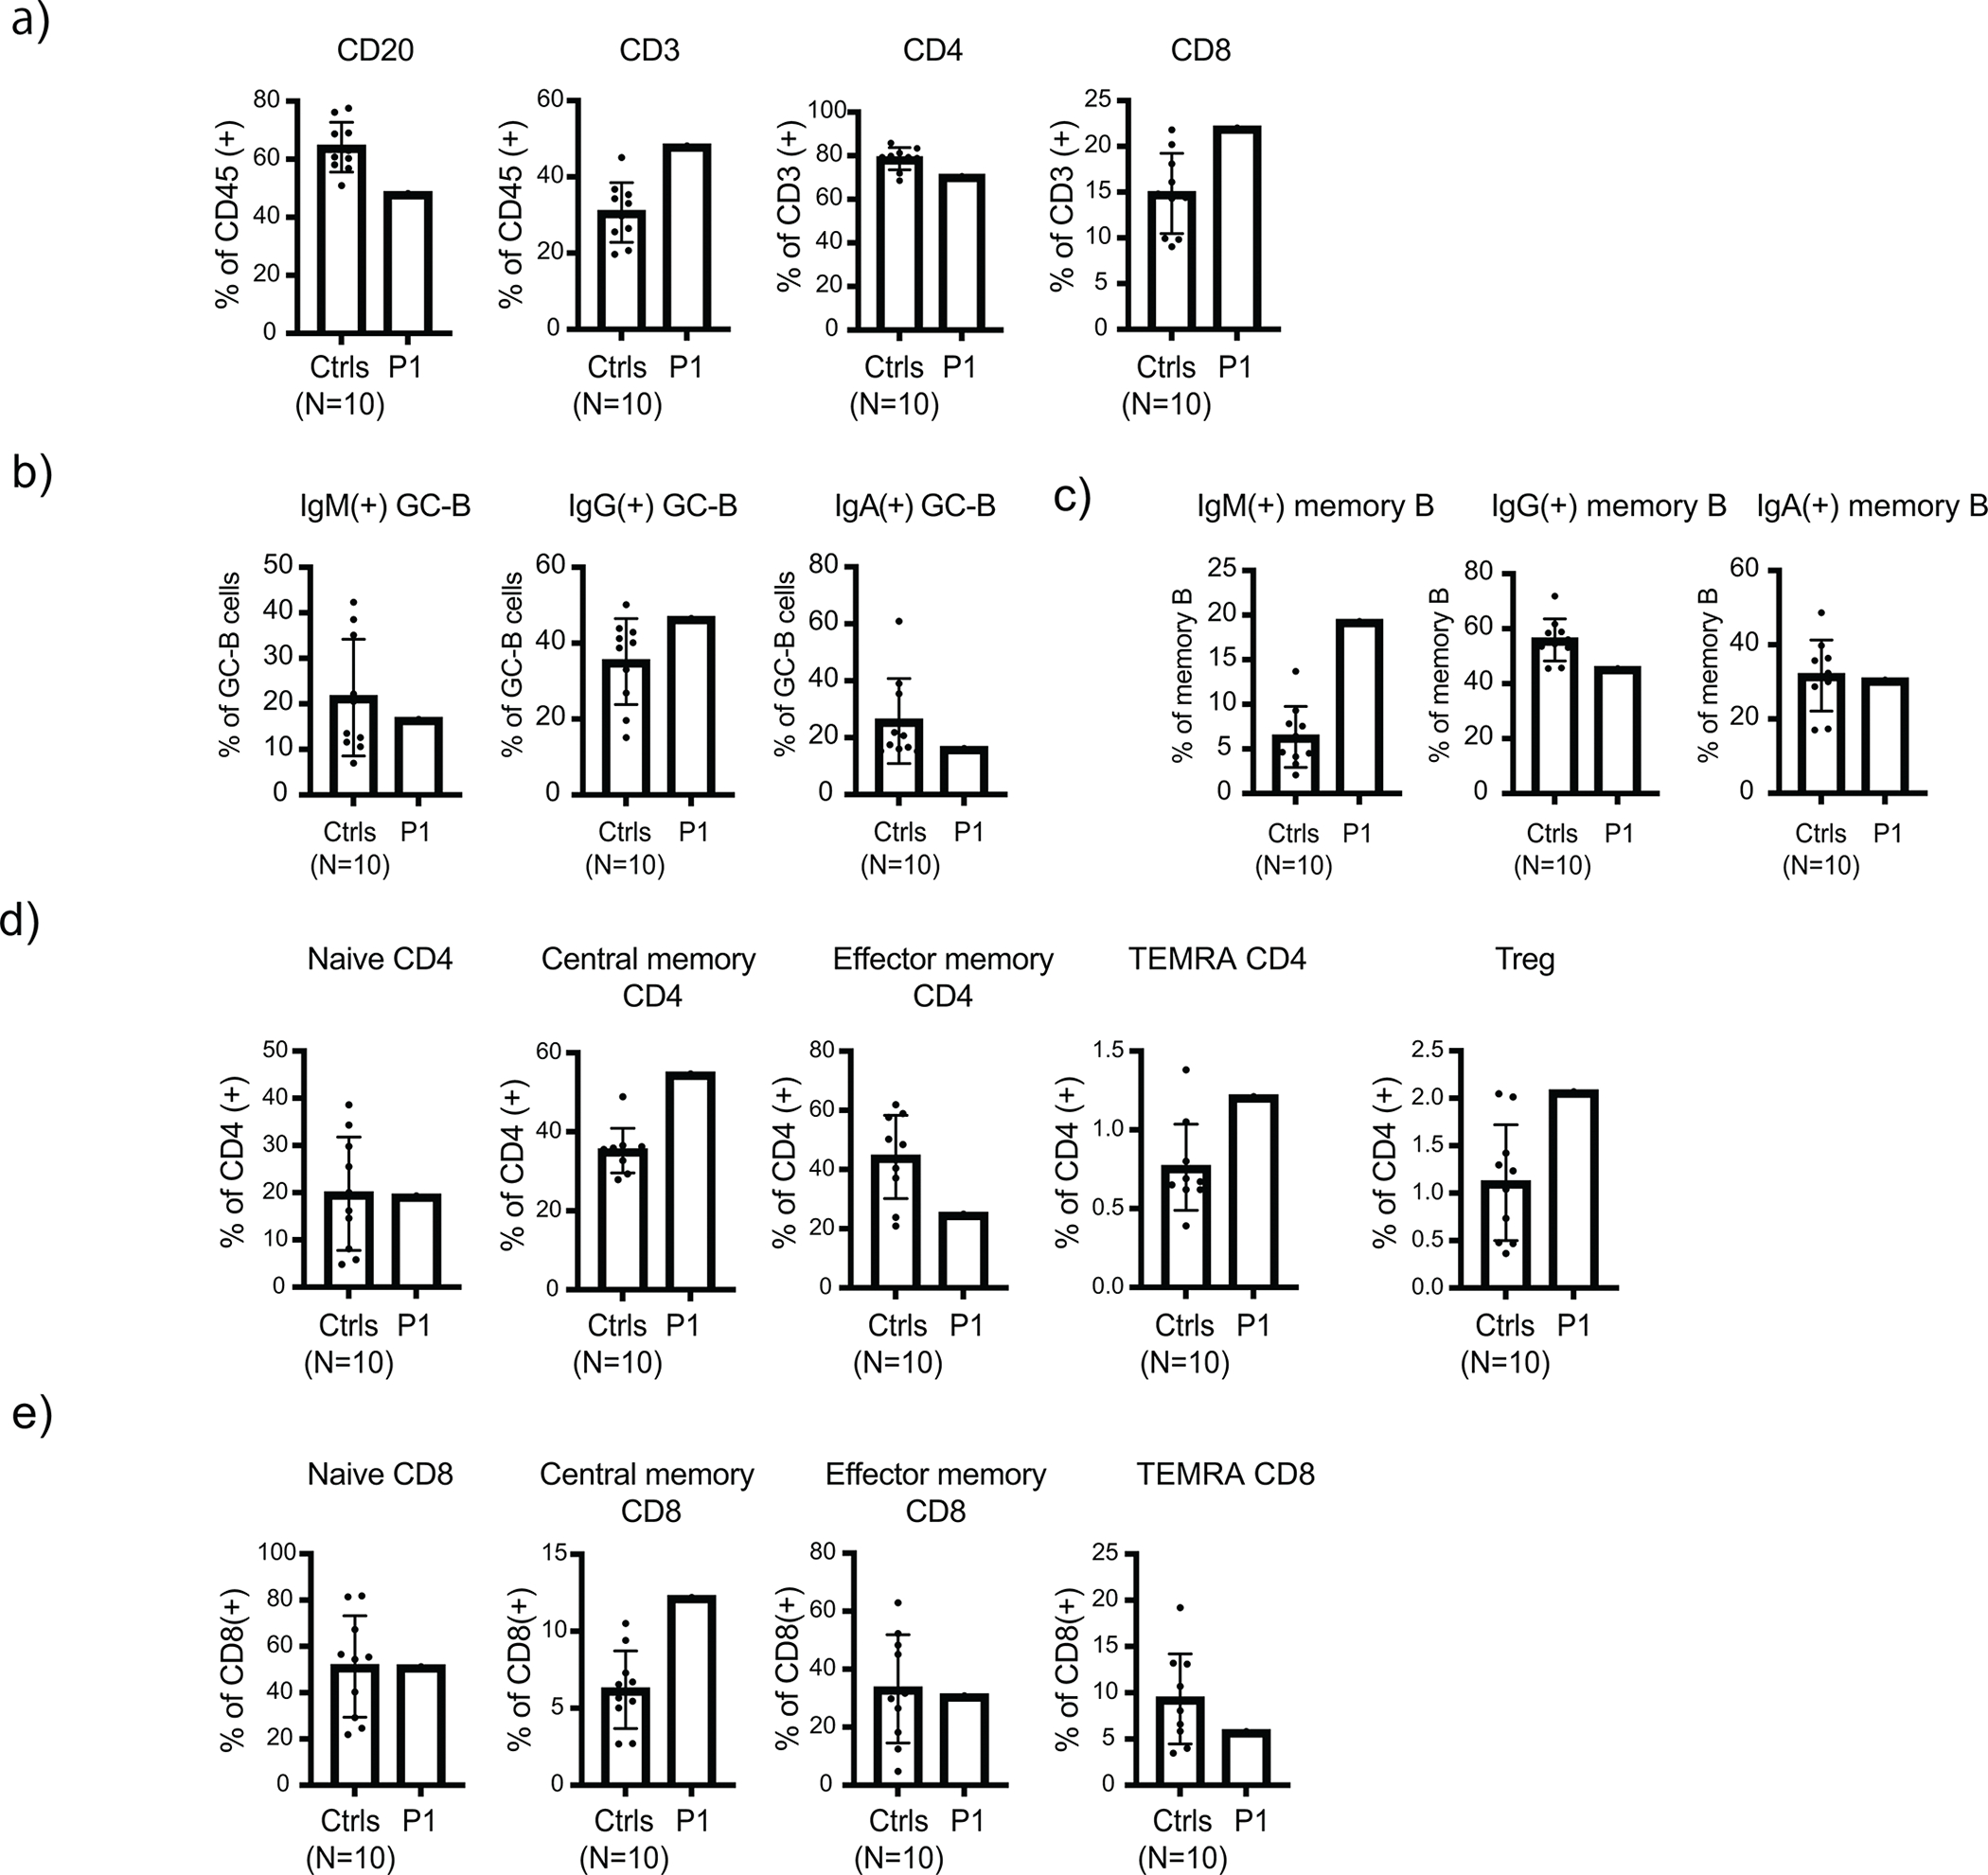
Extended Data Figure 7:

High dimensional spectral flow cytometry analysis of human adenoid samples. Adenoid single-cell suspensions from SHARPIN-deficient P1 and 10 unrelated pediatric control donors were analyzed. (a) Quantification of CD3+, CD4+, CD8+ and CD20+ populations in adenoid samples. (b-c) Surface immunoglobulin expression in GC-B (b) and memory B (c) populations. (d-e) Quantification of T cell subpopulations in the adenoid samples. Mean values ± s.d are displayed. The experiment was not repeated due to the limited amount of clinical specimens.
