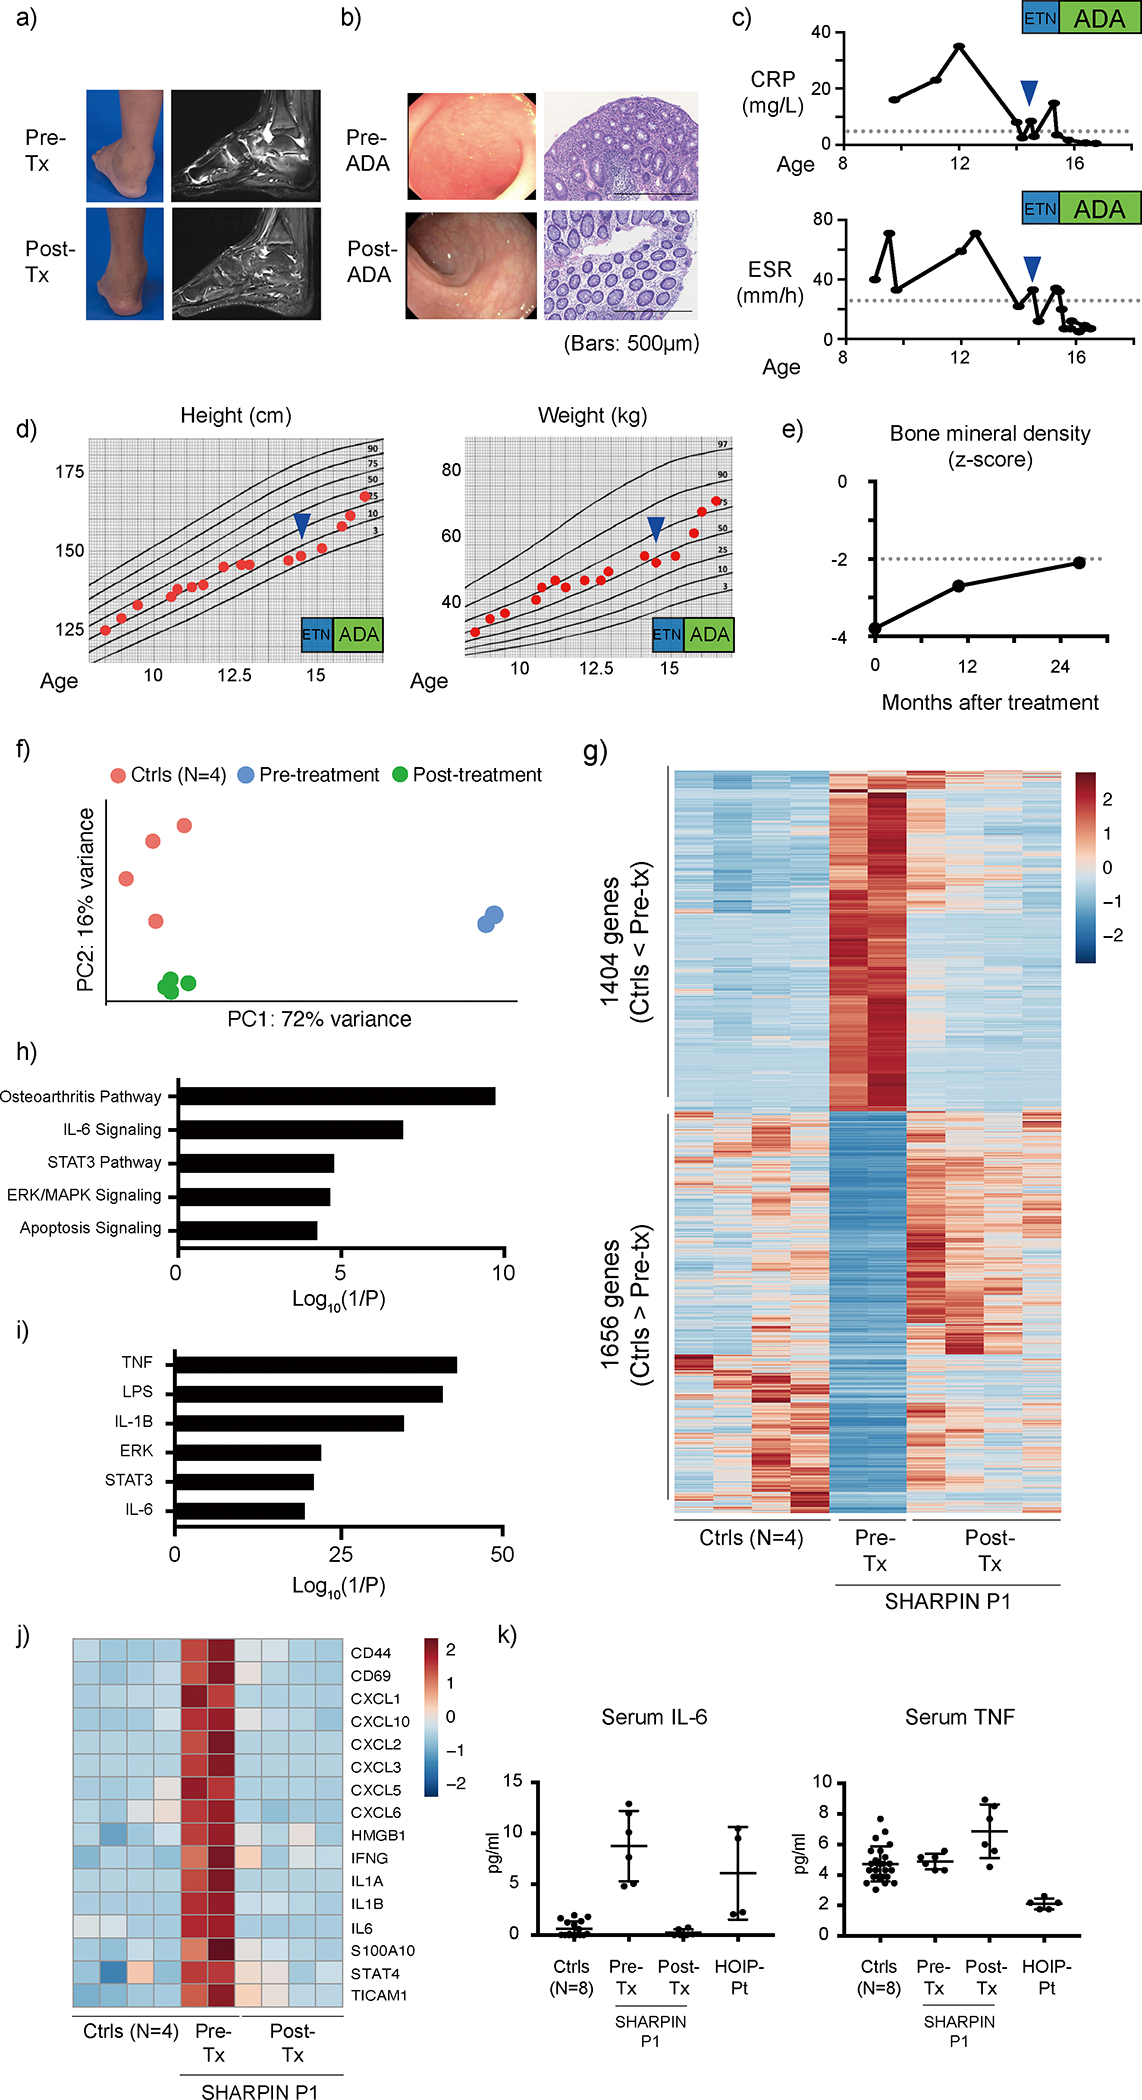
Figure 7: TNF inhibitors resolve the systemic inflammation of SHARPIN deficiency.

(a-b) Clinical evaluation of (a) joint inflammation and (b) colonic inflammation to TNF blockade in P1. (b) The histology images are representative of three biopsy specimens. (c) P1’s response of inflammatory markers to TNF blocking therapies. (a-c) CRP: C-reactive protein; ESR: erythrocyte sedimentation rate; ETN: etanercept; ADA: adalimumab. (d) Growth recovery of P1 after TNF blockade. (e) Recovery of bone mineral density in P1 after TNF blockade. (f) Principal component analysis using RNA sequencing data of pre- and post-treatment whole blood RNA samples from P1. (g) A heatmap showing differentially expressed genes between healthy donors (N=4) and biological replicate samples from P1 pre-treatment (N=2) and post-treatment (N=4). (h-i) Gene enrichment analysis of 1404 genes upregulated in pre-treatment P1 using Ingenuity Pathway Analysis software. (h) Pathway analysis; (i) upstream molecule analysis. (j) A heatmap demonstrating the upregulation of representative inflammation-related genes in pre-treatment samples from P1 and the response to treatment with TNF inhibitors. (k) Response of serum IL-6 and TNF to TNF blockade therapies in P1. Cytokine measurements were performed in technical duplicates from pre- and post-treatment serum samples from SHARPIN-deficient P1, and the results were compared with a HOIP-deficient patient and eight healthy unrelated donors. Mean values ± s.d are displayed. A representative data of two independent experiments.
