
Extended Data Figure 1: Genetic analysis, SHARPIN expression, complex I formation and non-canonical NF-κB activation.
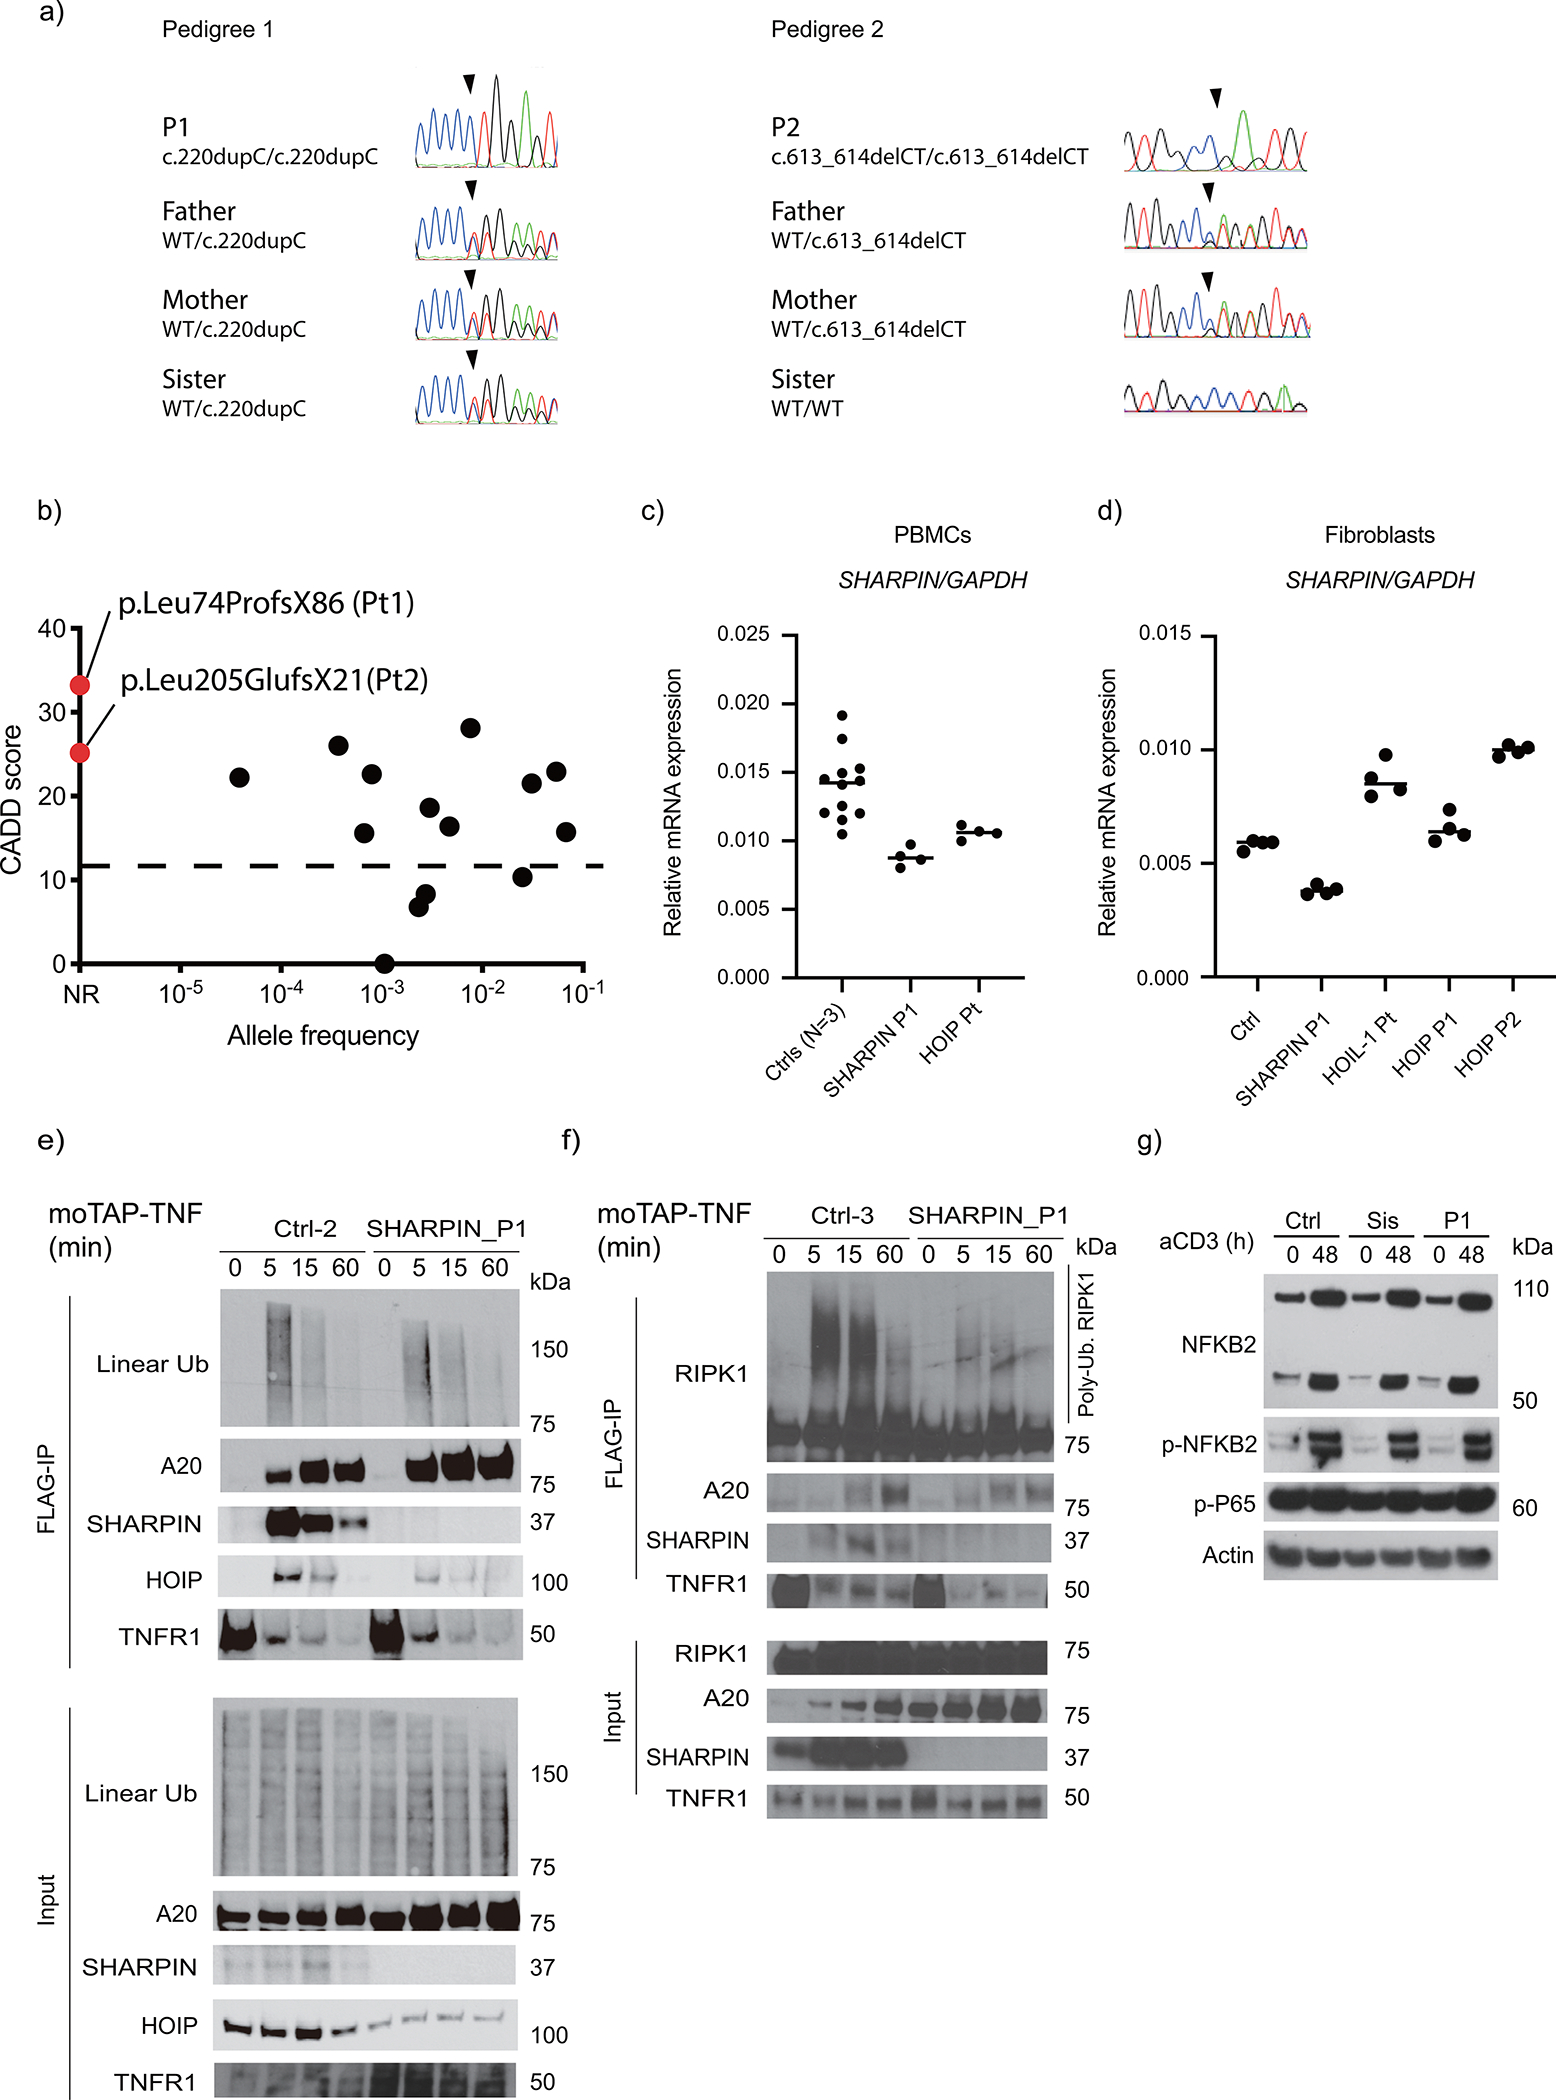
(a) Sanger sequence electropherograms demonstrating homozygous frameshift variants in the patients. (b) Population allele frequency and CADD score for SHARPIN variants homozygous in public databases. The two SHARPIN variants appear in red. CADD-Mutation Significance Score (MSC) cutoff for SHARPIN (90% confidence interval) was indicated by dashed line. NR: not reported. (c-d) Normalized mRNA levels of SHARPIN in (c) PBMCs and (d) fibroblasts from LUBAC-deficient patients and healthy controls. RNA was extracted from each sample and was measured with technical quadruplicates. Mean value is displayed as a bar. (e-f) TNFR1-signaling complex (TNFR1-SC) formation in fibroblasts from P1 and two unrelated healthy controls. Fibroblasts were stimulated with modified tandem affinity purification (moTAP)-tagged TNF (1 μg/ml) for the indicated times. TNFR1-SC was purified with anti-FLAG immunoprecipitation, and analyzed by western blotting. Supporting data for Fig. 2e. (g) Normal induction of non-canonical NF-κB in P1. Total PBMCs were stimulated with anti-CD3 (aCD3) for the indicated durations, and the expression of NFKB2 p100 (full length) and p52 (active form) was detected by western blot. Sis: P1’s sister carrying a heterozygous p.Leu74ProfsX86 variant. Representative result of two independent experiments.