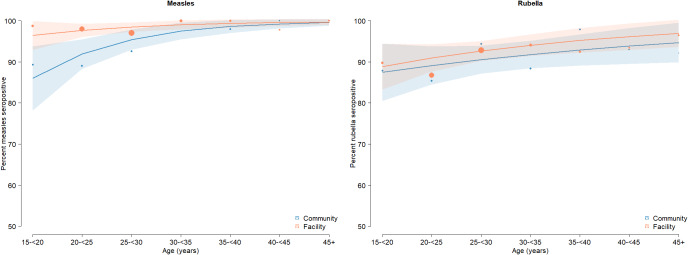
Figure 3.
Measles and rubella age-specific seroprevalence estimated from residual and community adult specimens.
Fitted line based on fractional polynomial models. Size of dots scaled by the number of specimens in each age bin. All adult residual specimens are included in these analyses (male and female).

