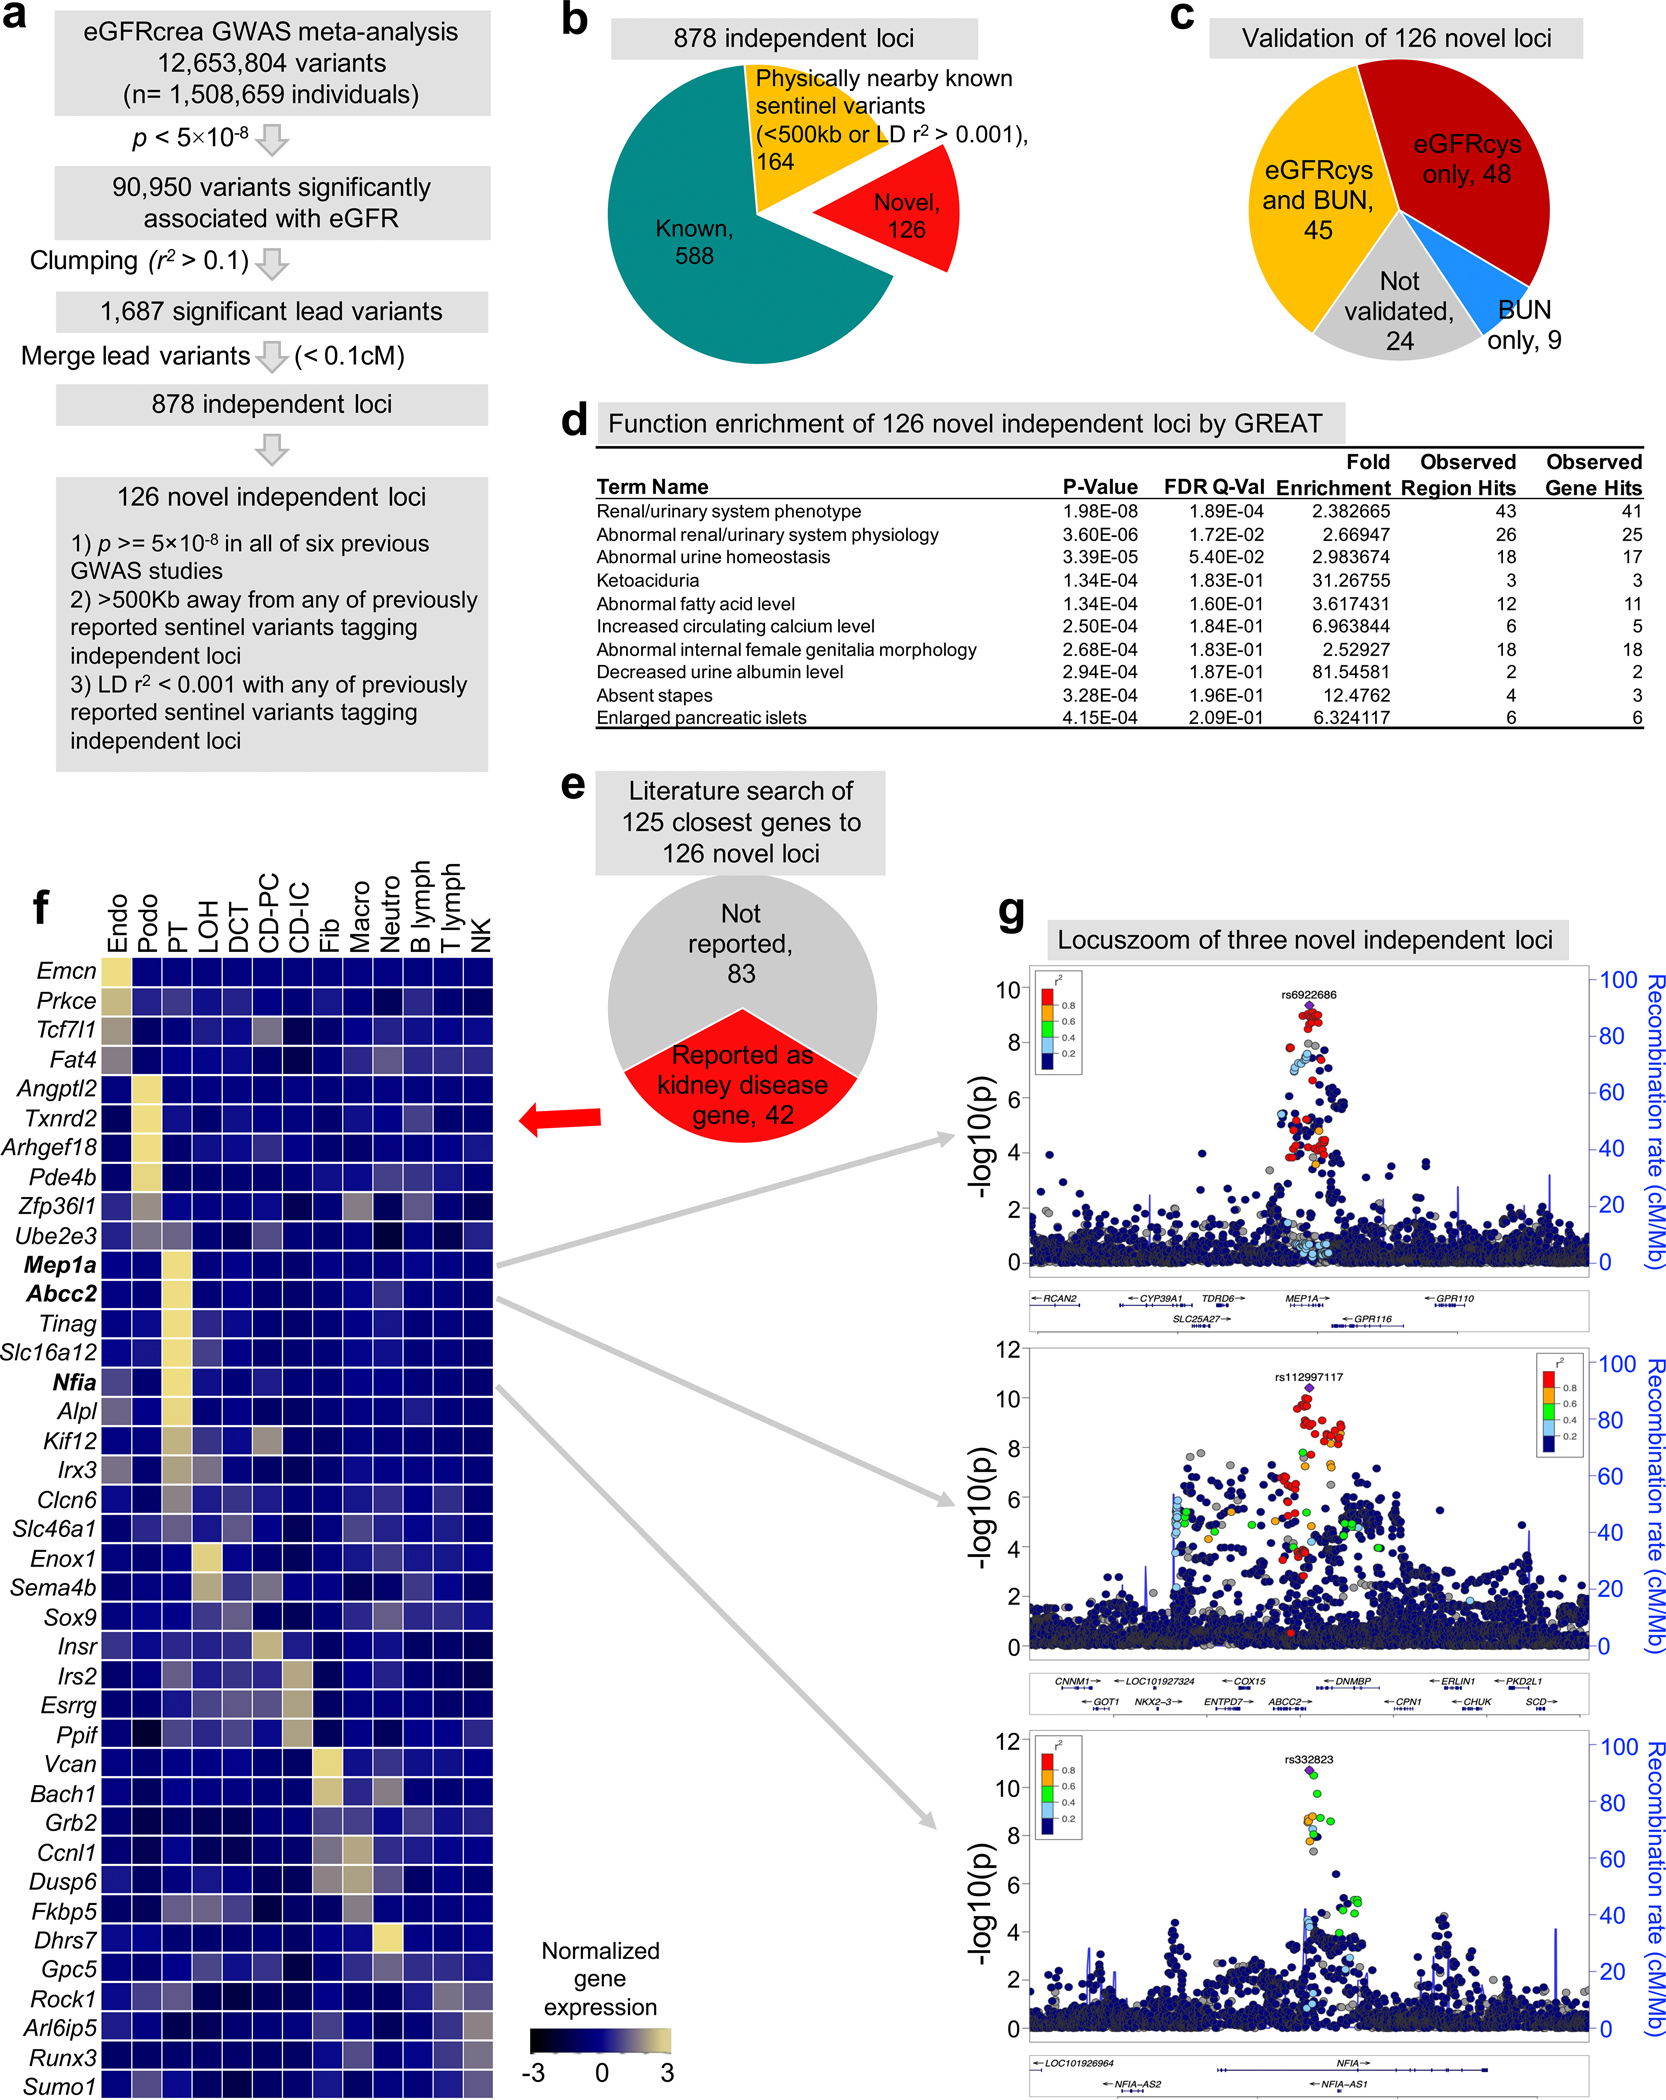
Extended_Data_Fig2. Identification and function annotation of independent eGFRcrea GWAS loci.

a. The strategy to identify independent loci and novel eGFRcrea GWAS loci.
b. Pie chart of the number of independent loci categorized into different groups by comparing previously reported sentinel variants tagging independent loci.
c. Pie chart of the number of novel independent loci validated by eGFRcys GWAS and/or BUN GWAS.
d. Functional enrichment analysis of 126 novel independent loci annotated by GREAT. The positions of lead SNPs were inputted into GREAT (http://great.stanford.edu/public/html/), and the two nearest genes within 1Mb were used for function enrichment in mouse phenotype catalogue. The two-sided uncorrected p-value was calculated by binomial test over inputted loci, and false discovery rate q-value was calculated for multiple test correction.
e. Literature-based gene function of the closest genes to the 126 novel kidney disease loci.
f. Expression of the mouse orthologues of 42 kidney disease genes (of the 126 newly identified GWAS genes) in adult mouse kidney samples (GSE107585). The mean expression was calculated for each cell types and z-scores were plotted.
g. LocusZoom view of three novel independent loci, MEP1A, ABCC2 and NFIA. Y-axis is strength of association -log10(two-sided p value from GWAS meta-analysis z-statistic).
