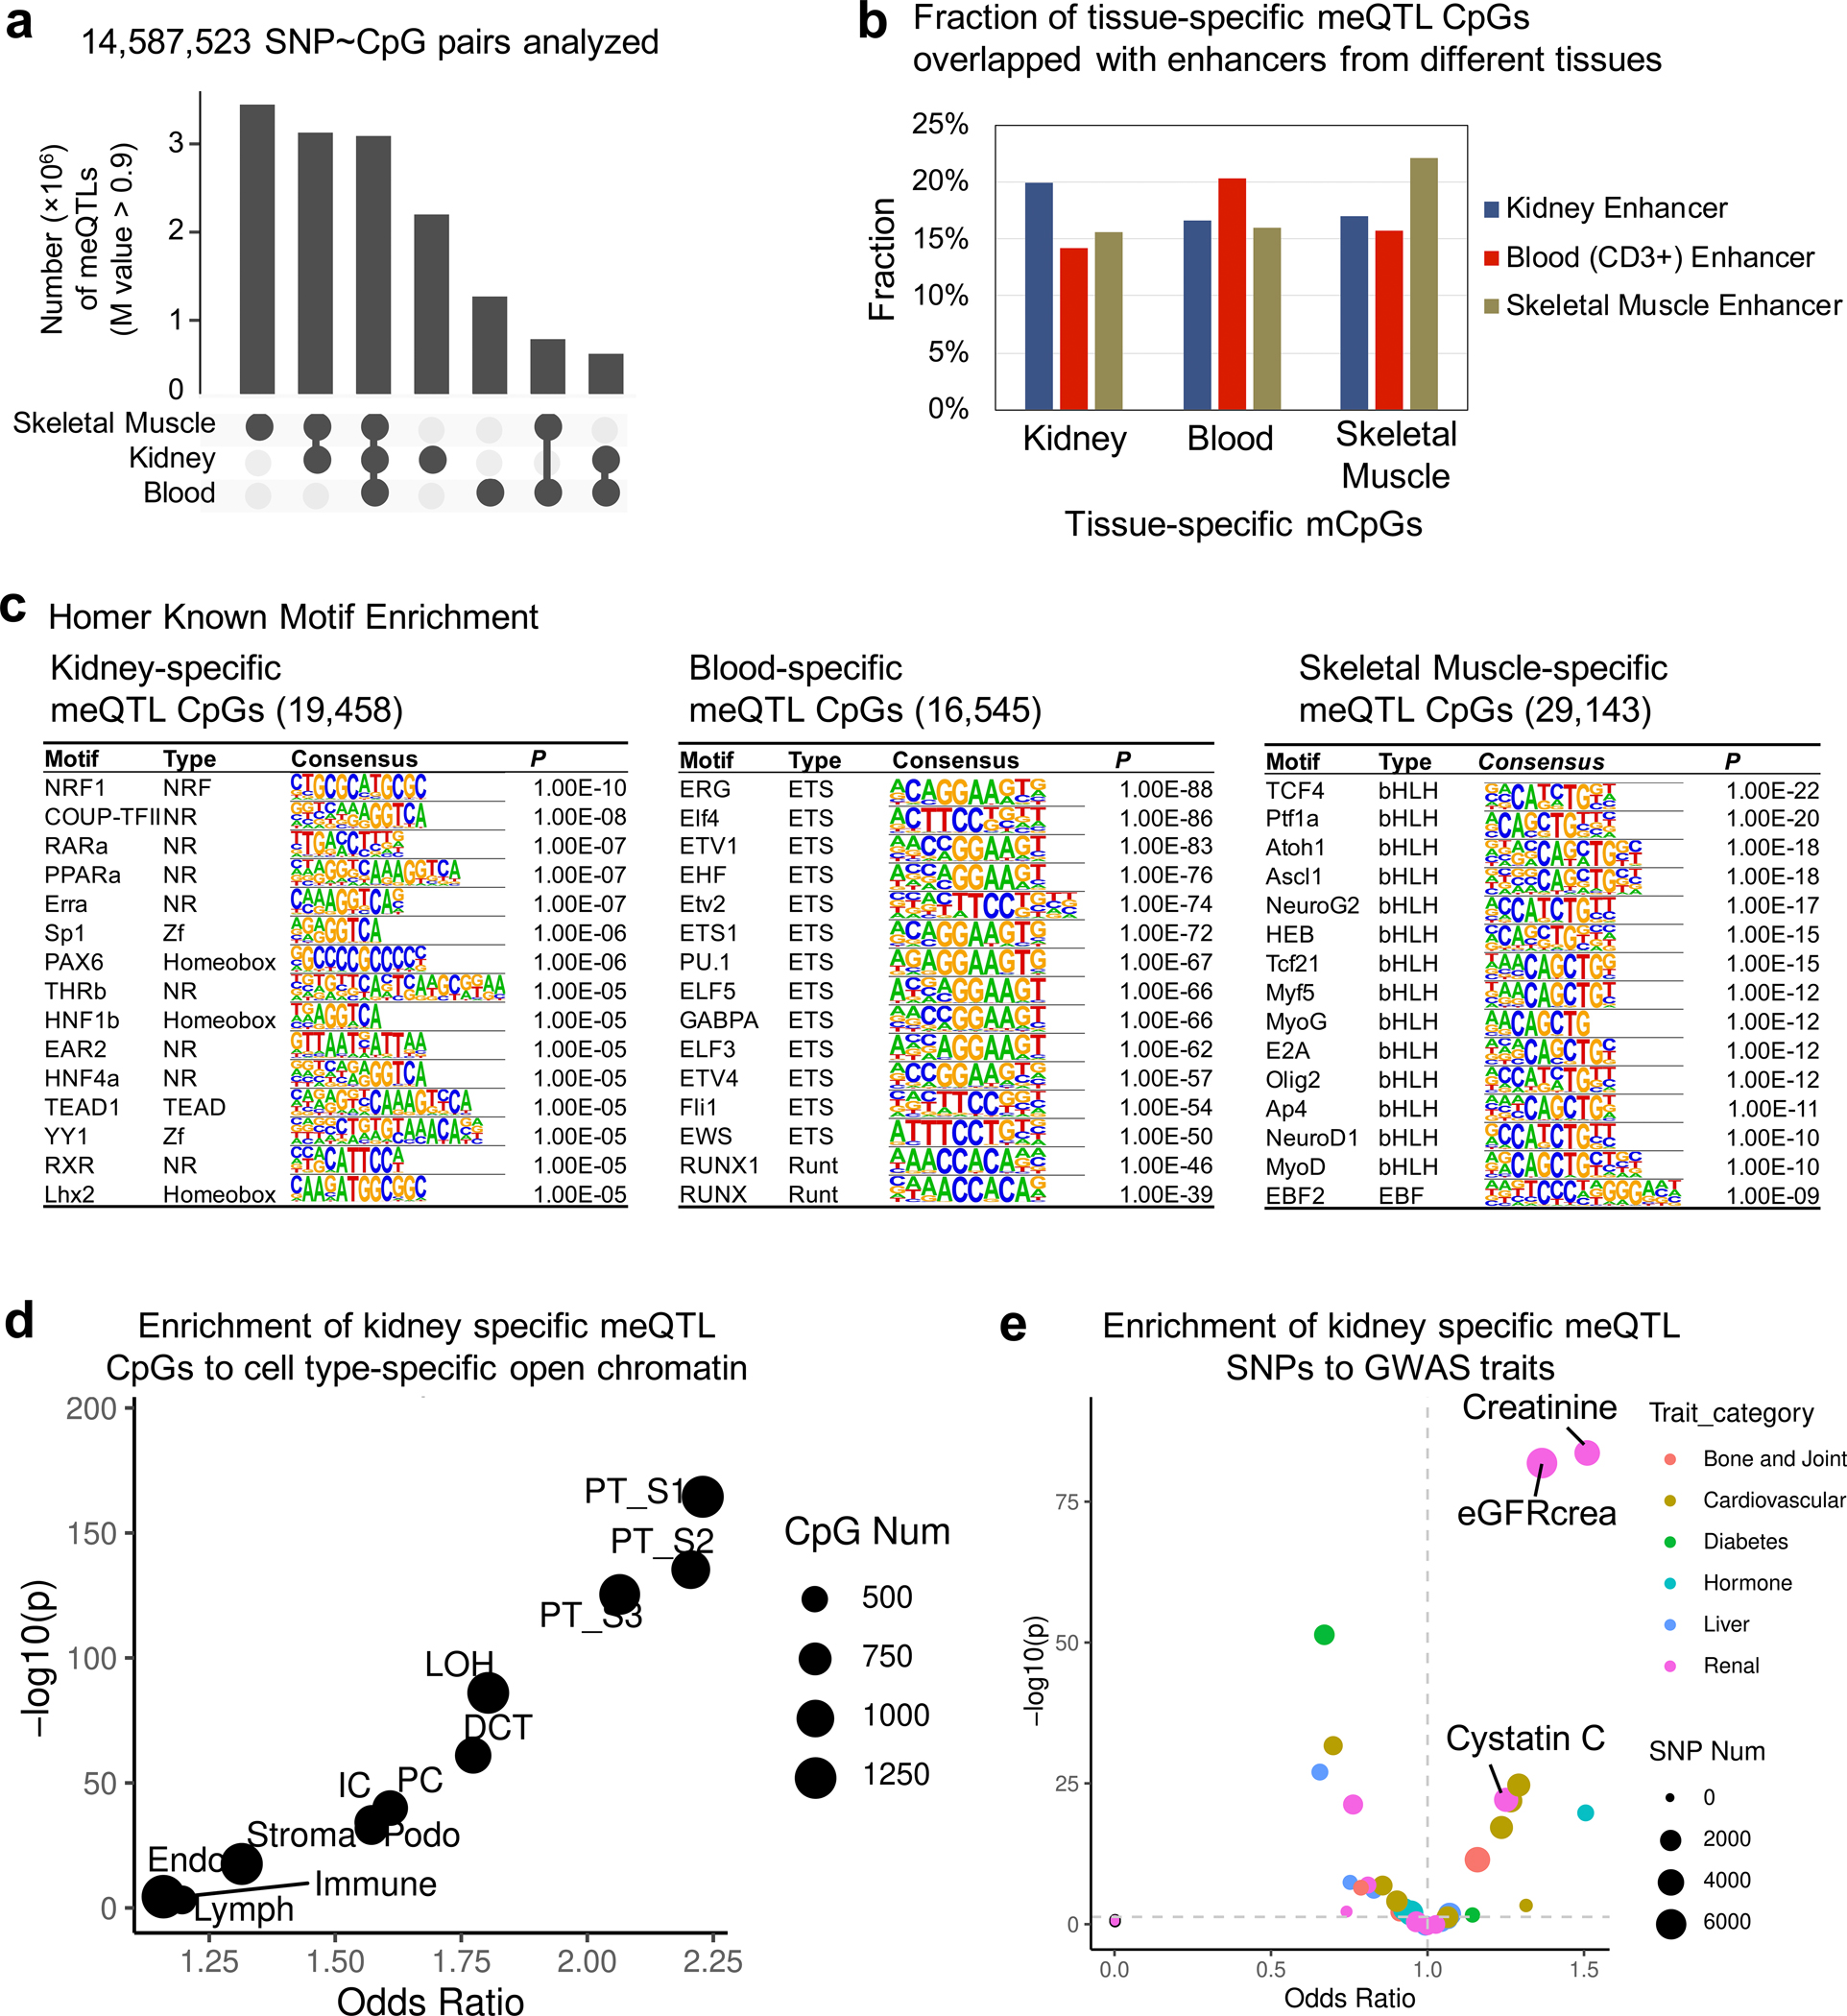
Extended_Data_Fig4. Functional annotation of kidney-specific meQTLs and mCpGs.

a. Tissue-specific and shared meQTLs across kidney, blood and skeletal muscle tissue. M value > 0.9 was used to define meQTL for each set.
b. Fraction of meQTL CpGs annotated by ChromHMM chromatin states in kidney, blood (CD3+) cell and skeletal muscle.
c. Transcription factor motif enrichment (HOMER) of tissue-specific mCpGs. The p value was calculated by binomial test.
d. Enrichment of kidney specific meQTL CpGs to cell type-specific open chromatin regions determined by snATAC-seq in human kidney. X-axis is odds ratio and Y-axis is strength of enrichment -log10(two-sided chi-square test p). Size of the dot represents the number of kidney-specific meQTL CpG sites.
e. Enrichment of kidney specific meQTL SNPs to GWAS traits. X-axis is odds ratio and Y-axis is strength of enrichment -log10(two-sided chi-square test p). Size of the dot represents the number of SNPs and colors represent the type of GWAS trait.
