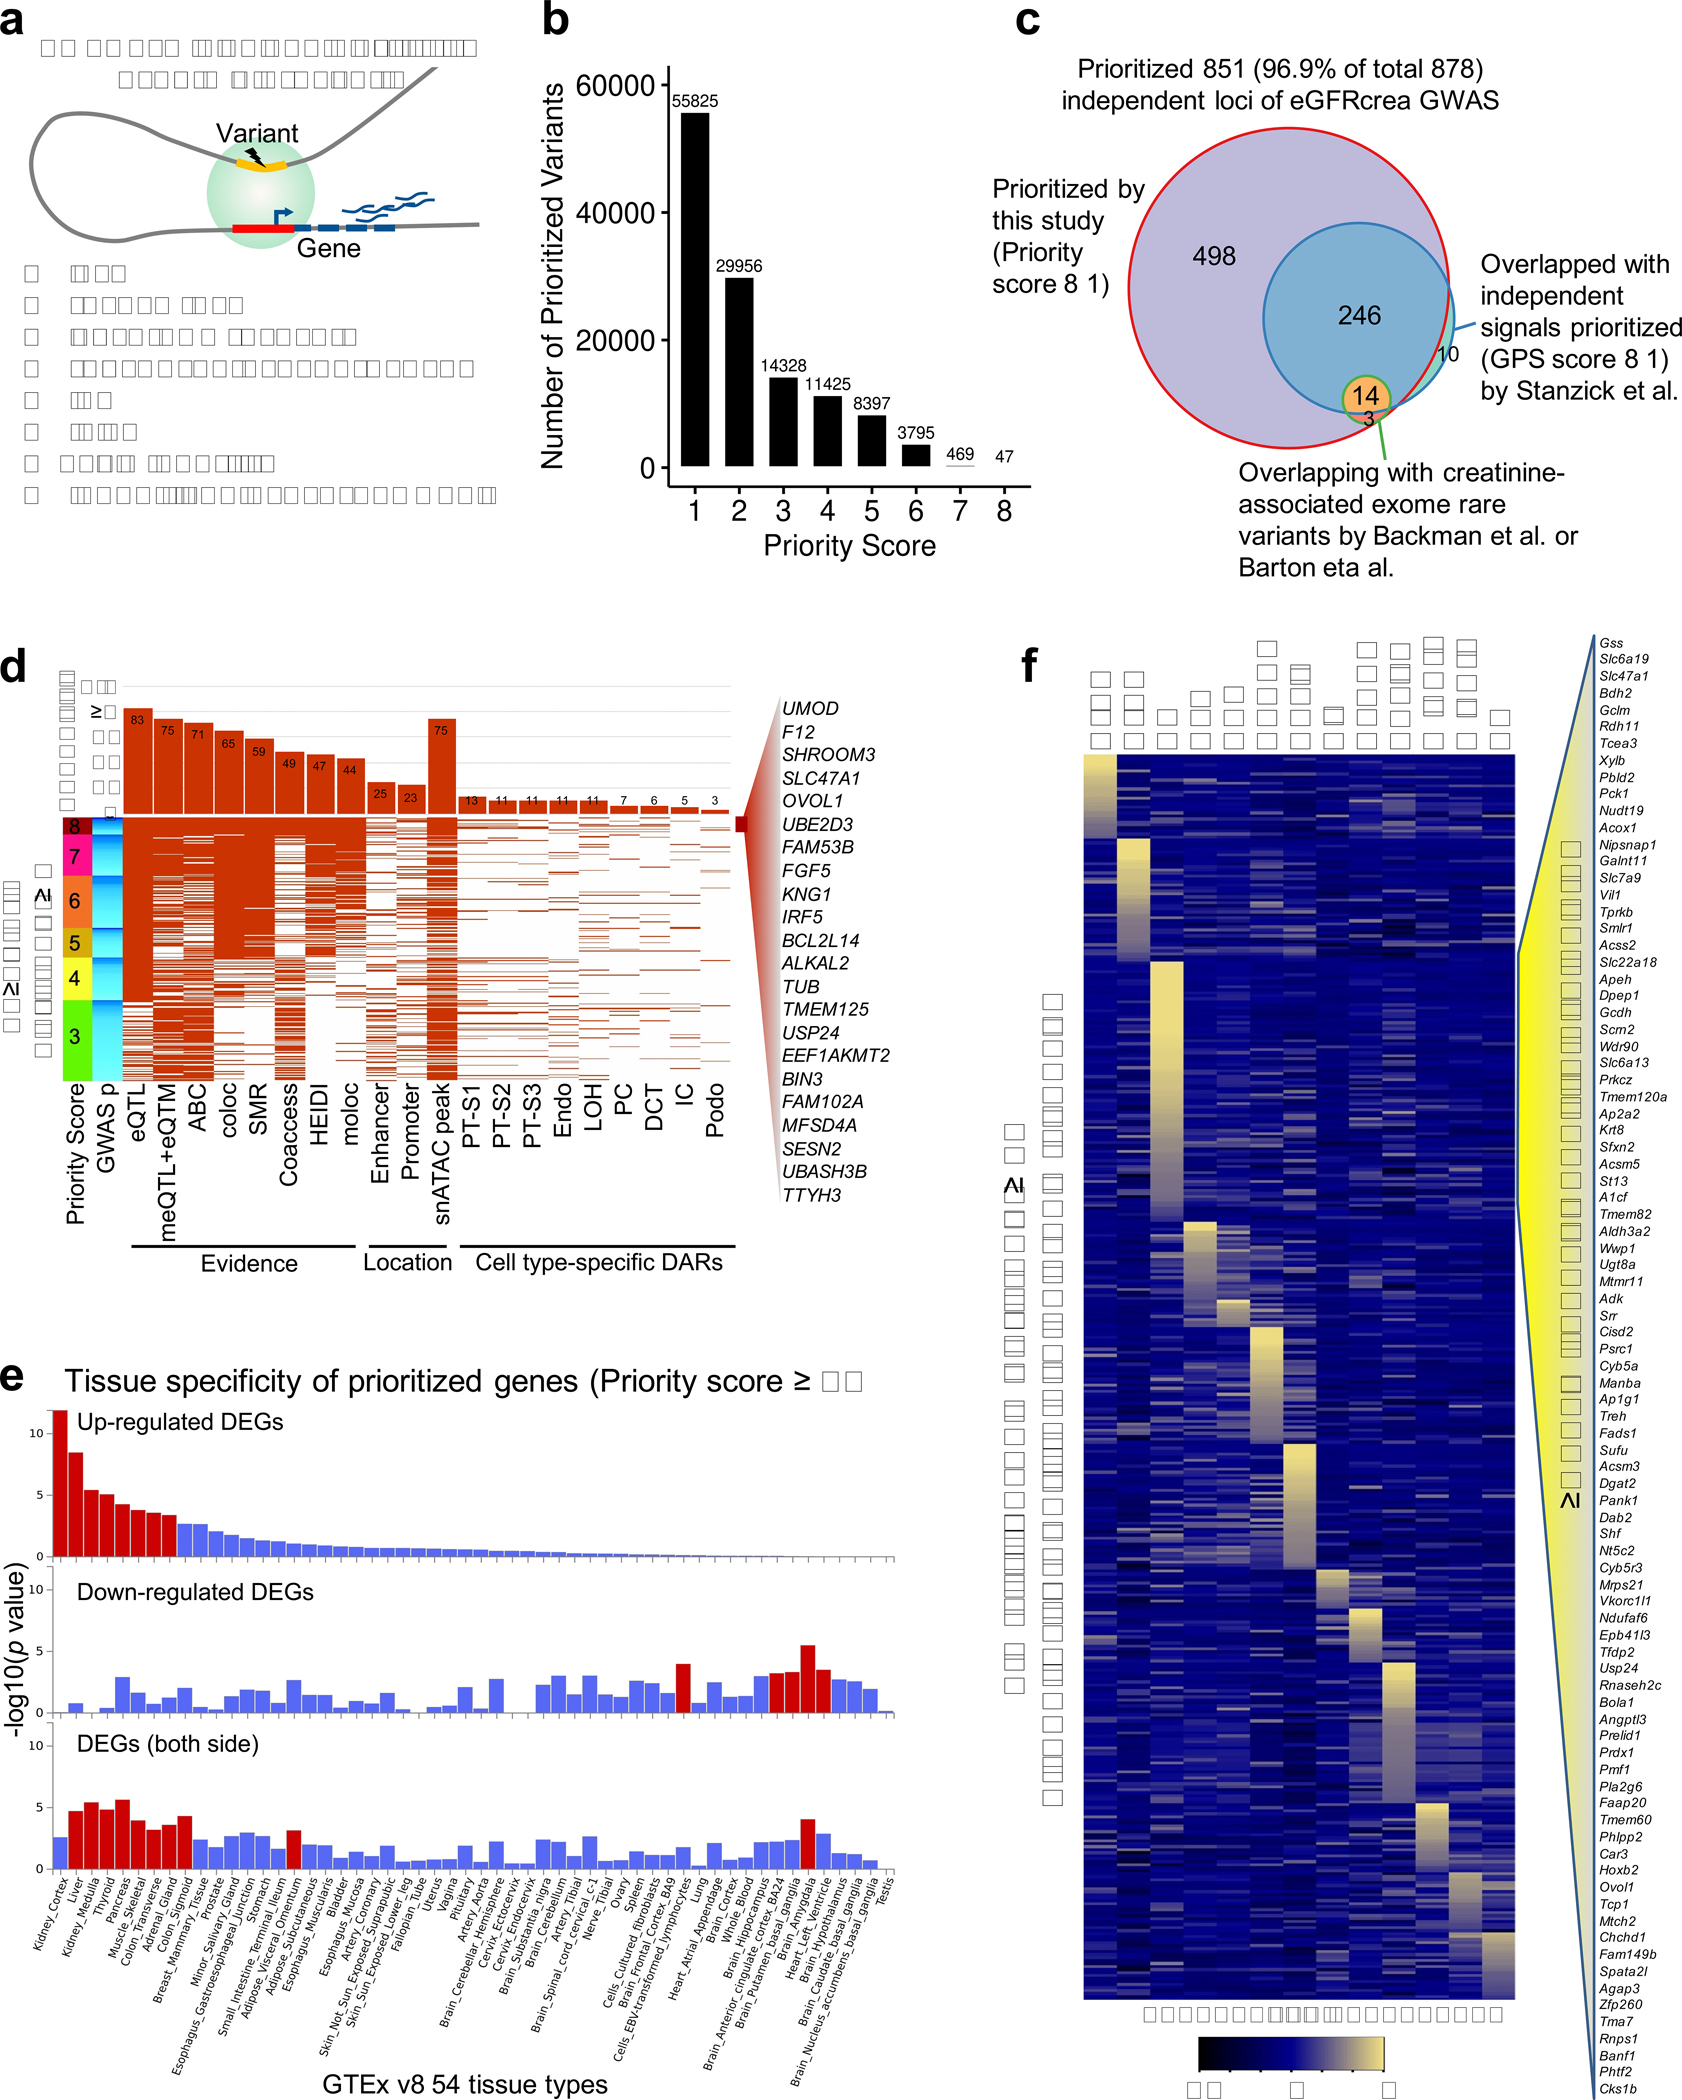
Extended_Data_Fig8. Gene prioritization for eGFRcrea GWAS variants and functional annotation.

a. Schematic representation of gene prioritization strategy based on eight prioritization datasets and methods.
b. Number of eGFRcrea GWAS variants prioritized using different priority score threshold.
c. eGFRcrea GWAS independent loci prioritized by this study (priority score ≥ 1) and previous studies. The number represents the number of independent loci overlapping with independent signals prioritized (GPS score ≥ 1) by Stanzick et al. and/or creatinine-associated exome rare variants by Backman et al. or Barton et al.
d. Features of the top variants prioritized for the 328 loci with priority score ≥ 3. Each row shows the top variant for each locus. Loci were ordered from top to bottom based on priority scores from 8 to 3. Loci with the same priority score were ordered by GWAS significance from strongest (dark blue) to lowest (light blue). Each column represents a feature overlapped with the variant. For each feature, the fraction of overlapping variants is shown in the upper panel. 22 top prioritized genes supported by all eight datasets and methods were listed.
e. Tissue specificity of 566 prioritized genes (priority score ≥ 3) in 54 tissue types (GTEx v8) using GENE2FUNC of FUMA. The x-axis is the 54 tissue types ordered according to significance of enrichment in up-regulated differentially expressed gene sets. Y-axis represents enrichment significance -log10(p value calculated by hypergeometric test). Tissue with Bonferroni p value < 0.05 is shown in red.
f. Heatmap of the expression of 417 mouse orthologues of prioritized genes in adult mouse kidney single cell dataset. The mean expression was calculated for each cell types and z-scores were plotted. Right panel shows 87 genes with the highest level of expression in proximal tubule cells.
