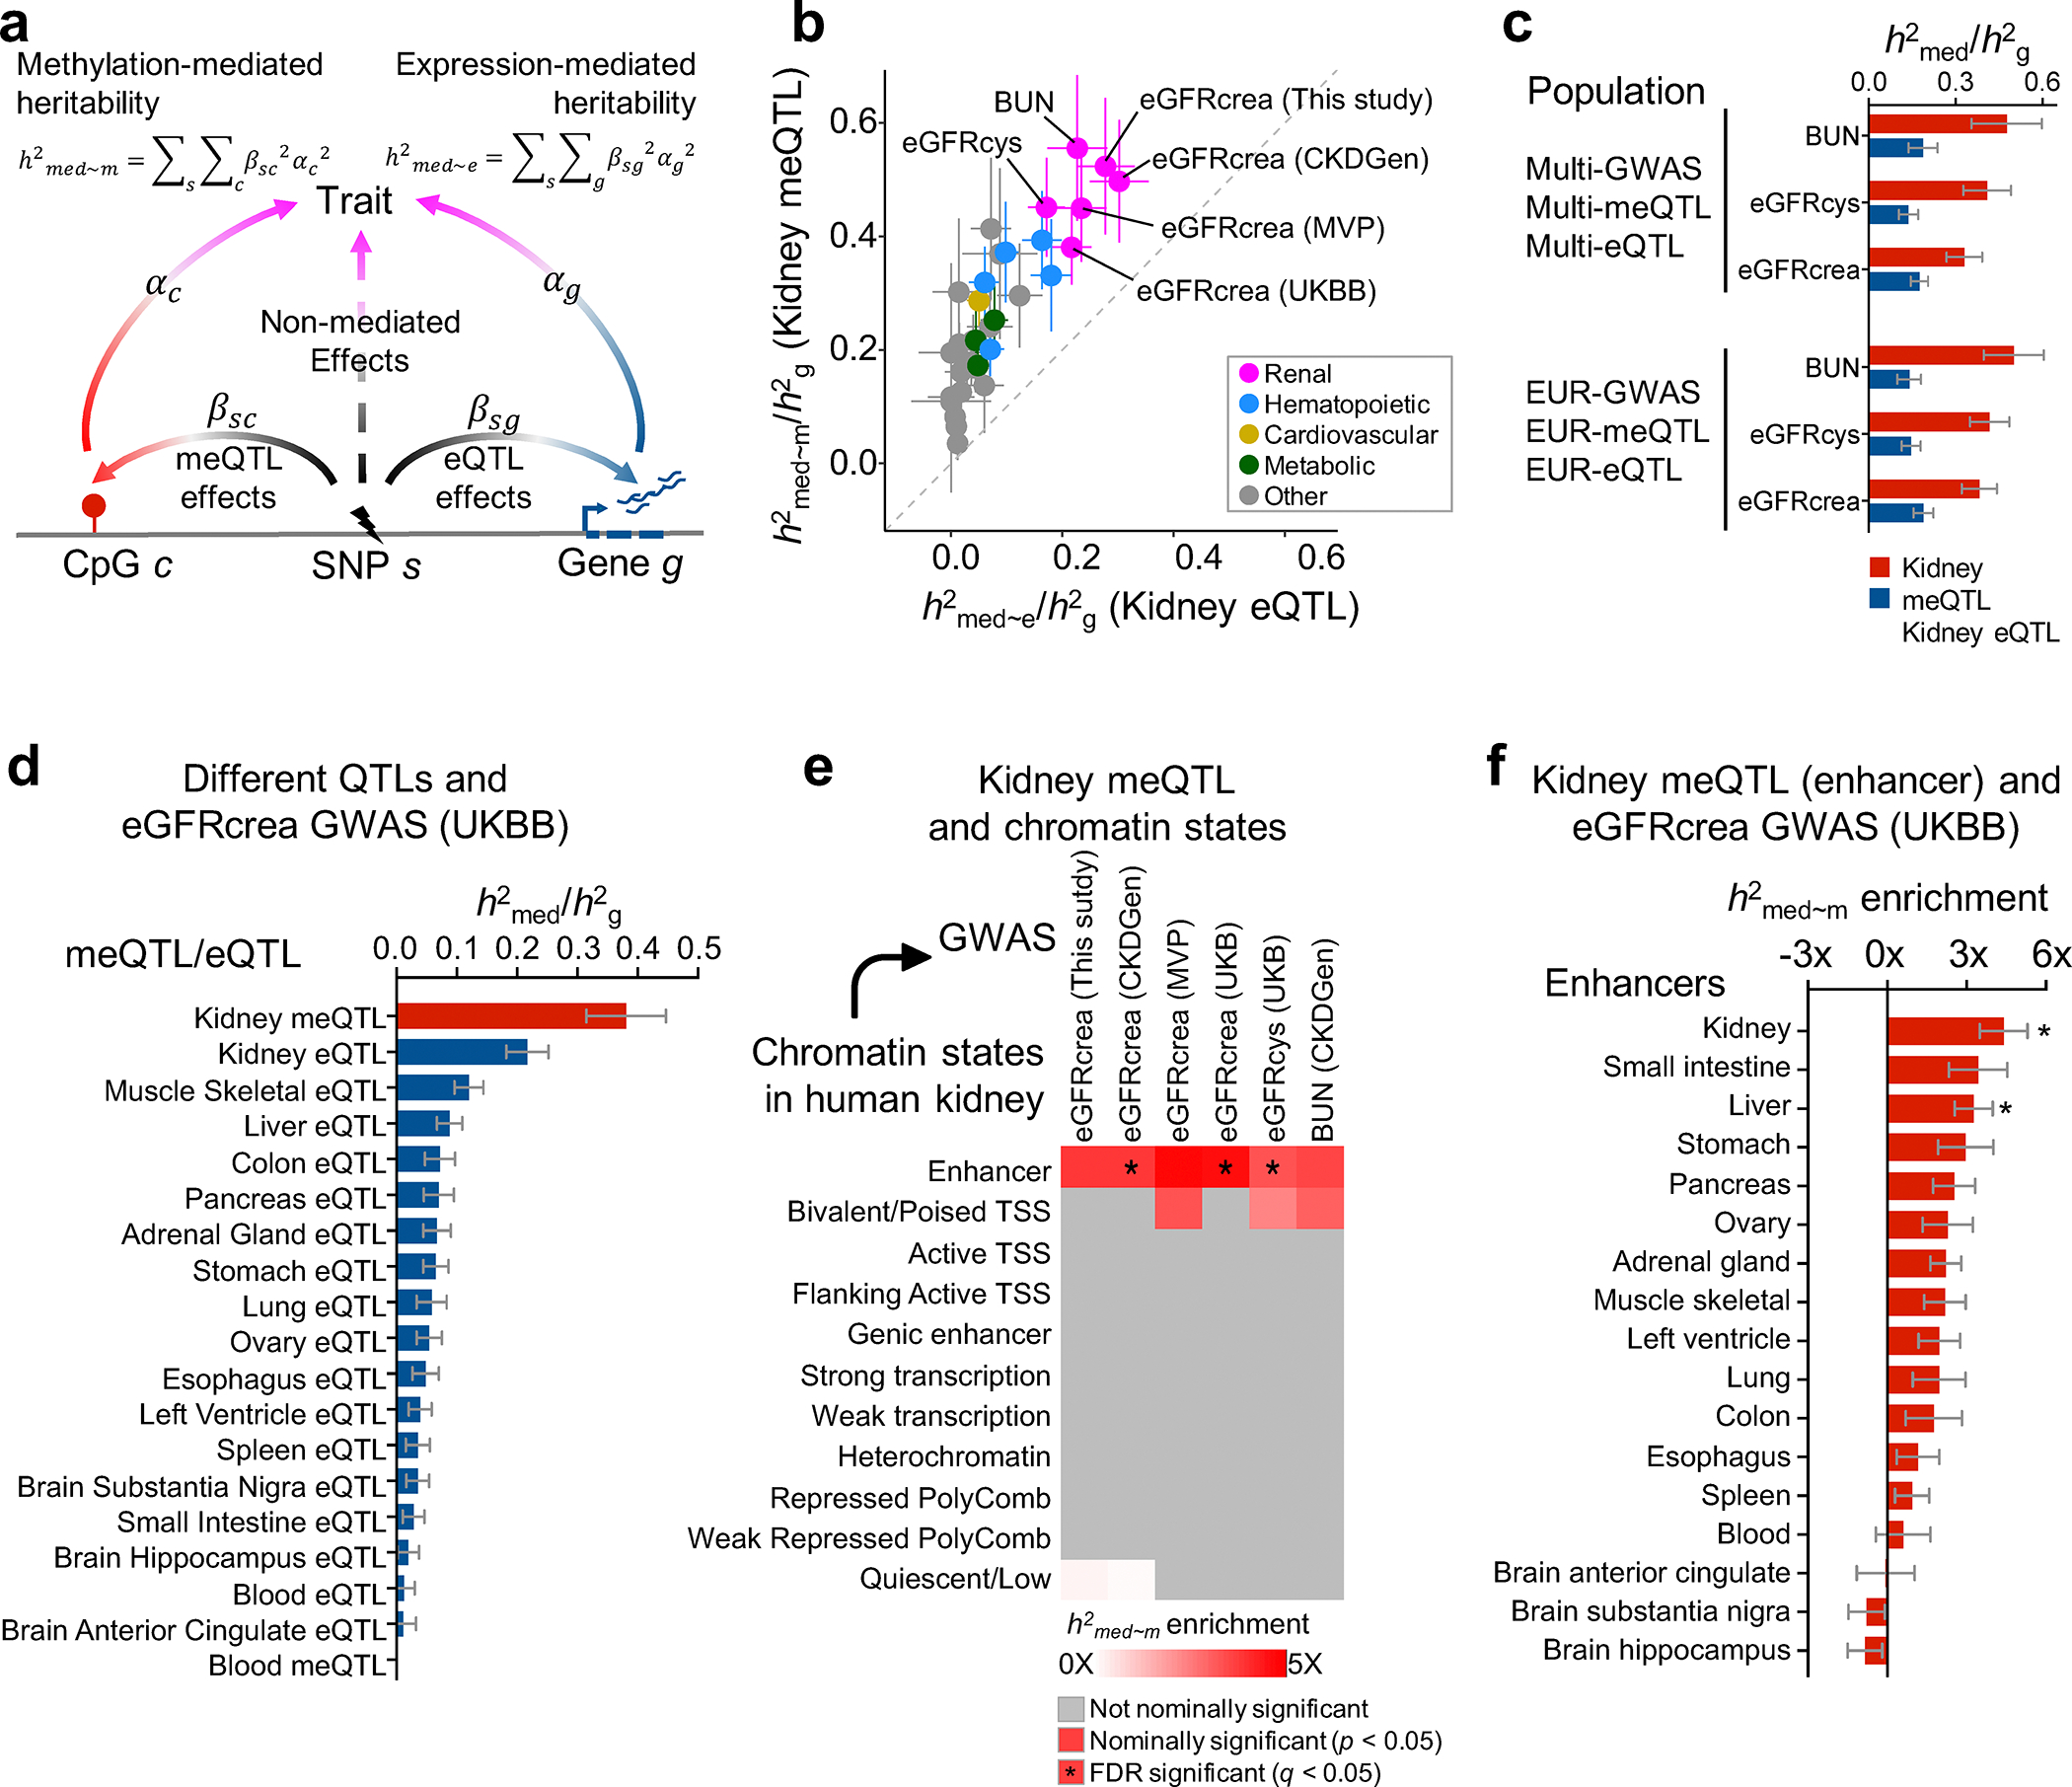
Fig. 4. Methylation variation explains a larger fraction of GWAS heritability than gene expression variation.

a. Schematic representation for estimation of heritability mediated by DNA methylation and gene expression using mediated expression score regression (MESC) analysis.
b. Estimated proportion of heritability () mediated by DNA methylation and gene expression in 414 kidneys across 34 GWAS traits. The y-axis represents mediated by methylation, while the x-axis mediated by expression. The color represents the type of the GWAS trait, error bars represent jackknife standard errors estimated for mediated by methylation and expression, respectively.
c. Estimated proportion of heritability () by multi-ancestry and European (only) ancestry datasets for kidney function GWAS traits (eGFRcrea, eGFRcys and BUN). The x-axis represents . For each bar plot, the center of error bar represents the value of , and error bar represent jackknife standard error.
d. Estimated proportion of heritability mediated by meQTLs and eQTLs from kidney and other tissue for eGFRcrea GWAS (n = 421,531 UKBB individuals). The x-axis represents , while the y-axis represents eQTL or meQTL data obtained from different tissues. meQTL data are shown in red and eQTL in blue. For each bar plot, the center of error bar represents the value of , and error bar represents jackknife standard error. See estimates of for other QTLs in Extended Data Fig. 6d.
e. Enrichment of kidney methylation-mediated heritability for kidney function GWAS traits (x-axis) in different ChromHMM regulatory elements (y-axis). White to red indicates enrichment (nominal two-sided p < 0.05 calculated by MESC). Asterisk indicates enrichment passing FDR q < 0.05 (accounting for 374 tests for 11 chromatin state CpG sets and 34 GWAS traits, Supplementary Fig. 7). TSS, transcription start site.
f. Enrichment of kidney methylation-mediated heritability (x-axis) for eGFRcrea GWAS (n = 421,531 UKBB individuals) in enhancers of different tissues (y-axis). For each bar plot, the center of error bar represents the enrichment score, and error bar represents jackknife standard error. Asterisk indicates enrichment passing FDR q < 0.05 (accounting for 4,352 tests for 128 enhancer CpG sets and 34 GWAS traits, Extended Data Fig. 7a).
