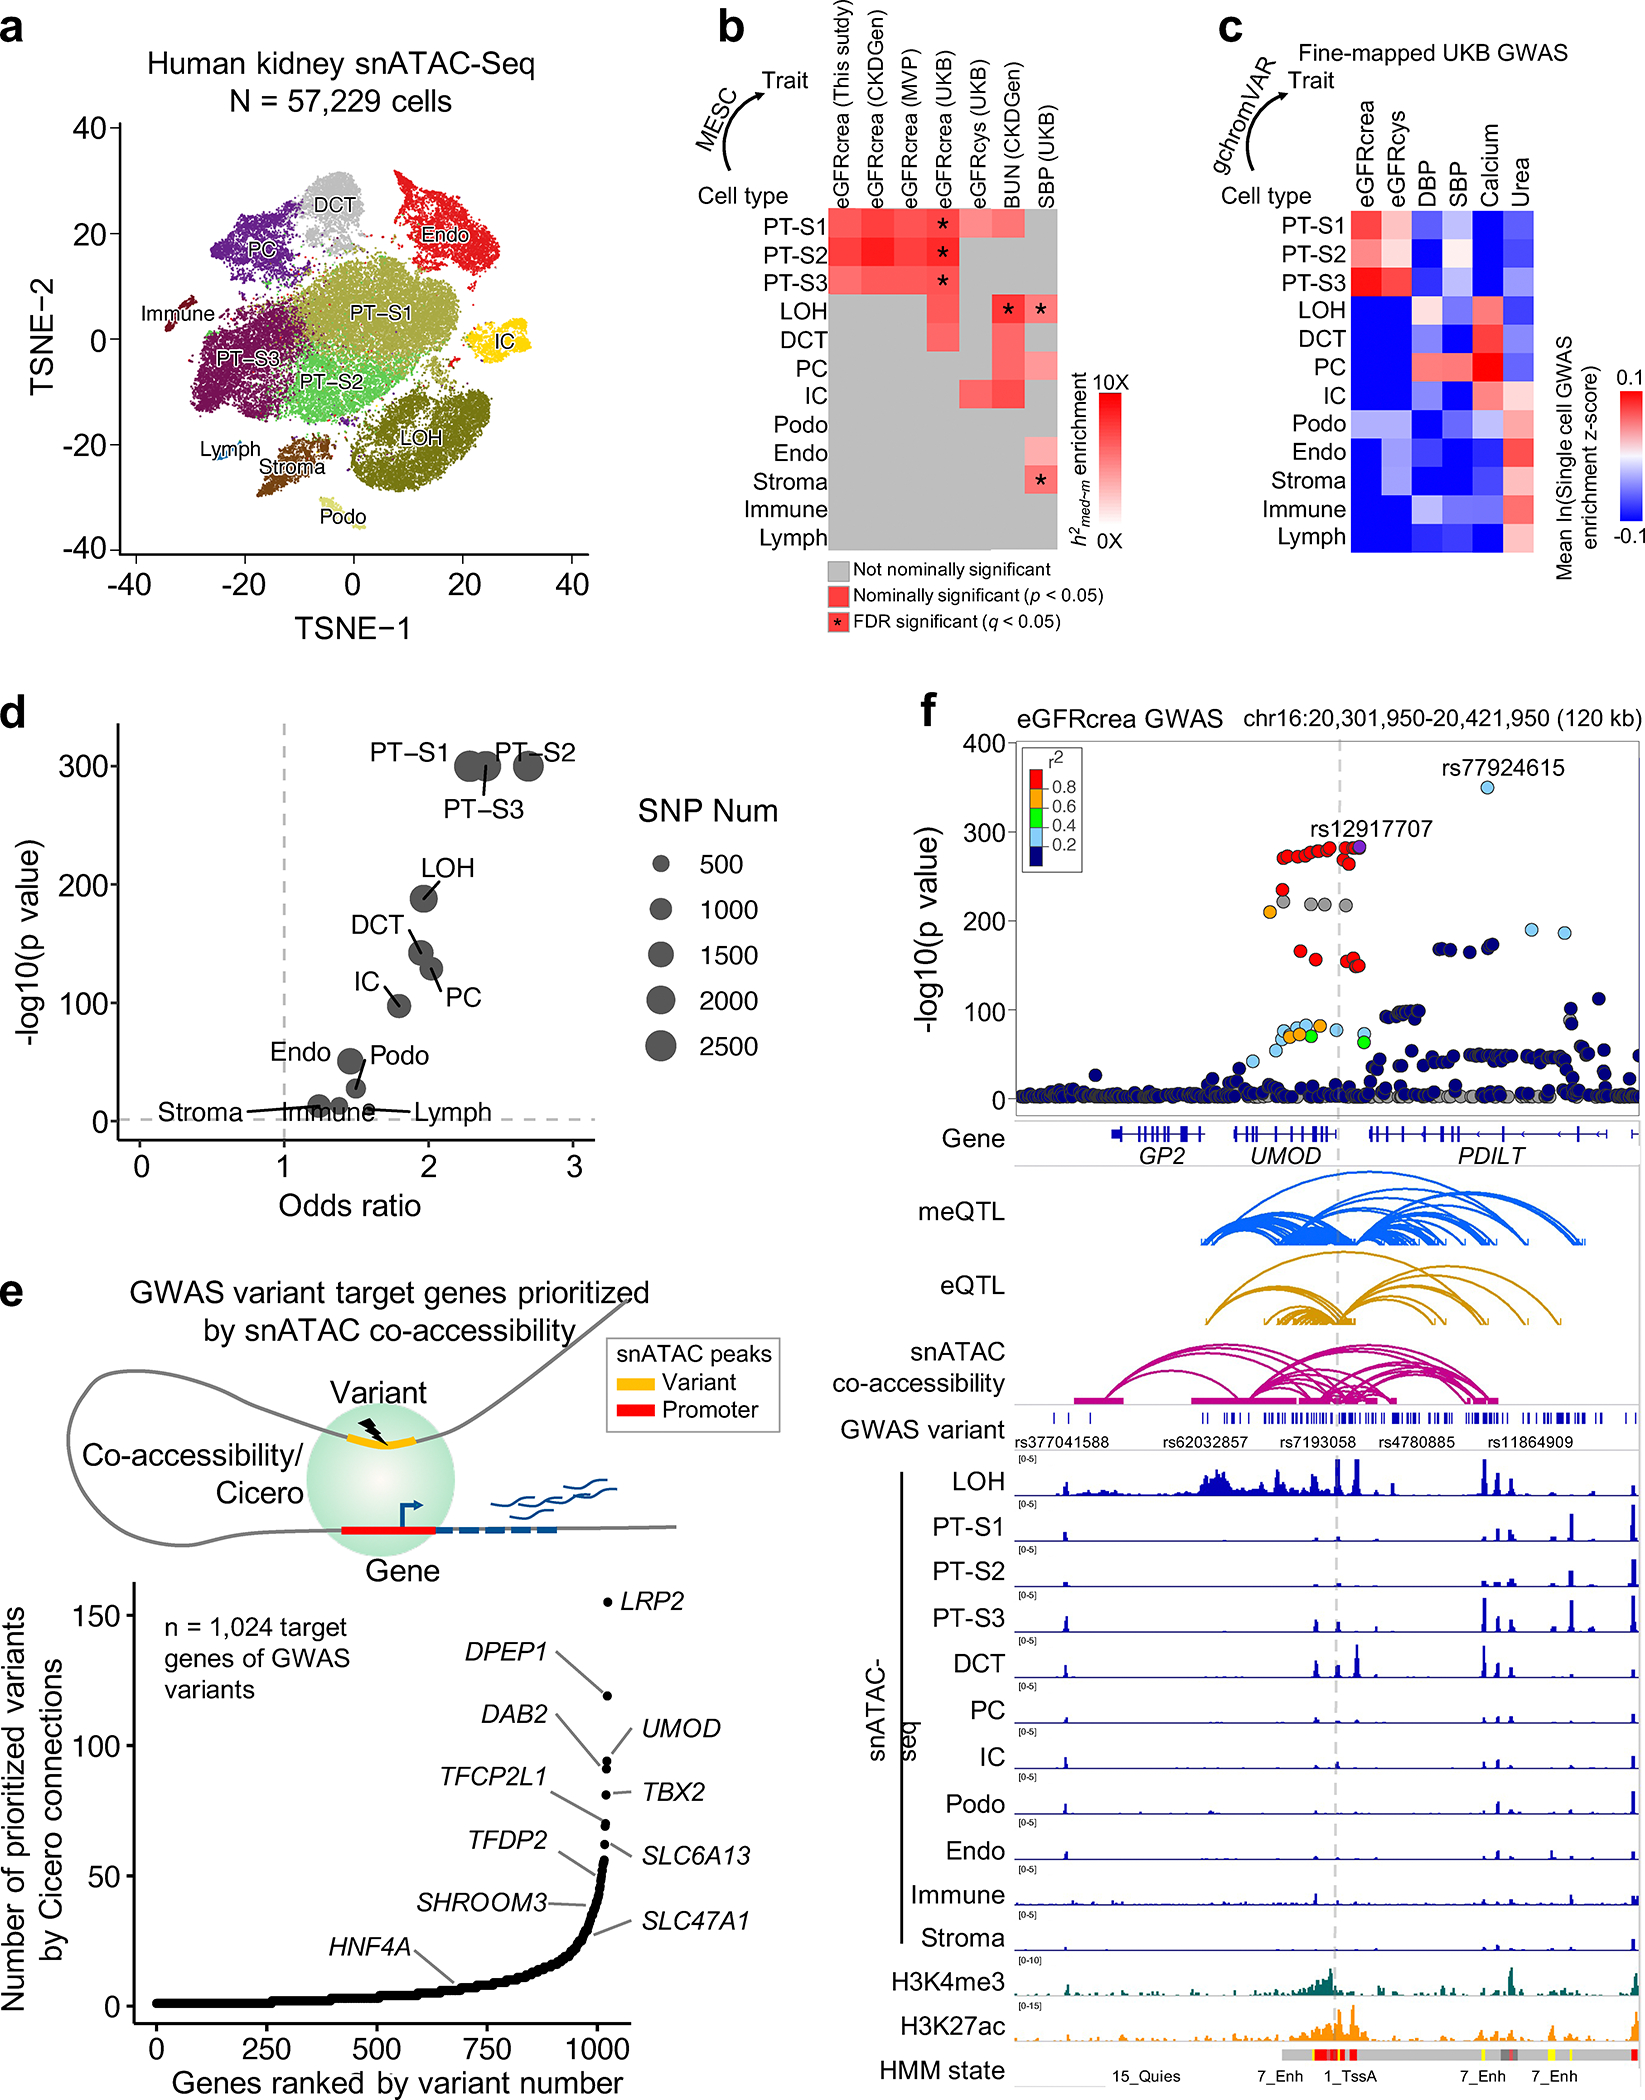
Fig. 5. Single cell chromatin accessibility map enables target cell type and gene prioritization for GWAS variants.

a. Single cell resolution accessibility maps for 57,229 human kidney cells by snATAC-seq. The x-axis and y-axis represent t-SNE dimension 1 and 2, respectively. Each dot represents a cell and color represents cell type such as PT-S1–3: proximal tubule S1–3 segment, LOH: loop of Henle, DCT: distal convoluted tubule, PC: principal cell of collecting duct, IC: intercalated cell of collecting duct, Endo: endothelial cells, Podo: Podocyte, Immune cell, Lymph cells, and Stroma cell.
b. Enrichment of kidney methylation-mediated heritability for kidney function GWAS traits (x-axis) in kidney cell type-specific accessible regions (y-axis). White to red indicates enrichment (nominal p < 0.05 calculated by MESC). Asterisk indicates enrichment passing FDR q < 0.05 (accounting for 408 tests for 12 cell type CpG sets and 34 GWAS traits, Supplementary Fig. 8a).
c. Single cell GWAS trait enrichment in human kidney cells by gchromVAR. X-axis shows fine-mapped GWAS traits, and y-axis cell types. The single cell GWAS enrichment z-score mean value of all cells in each cell type is represented by blue (low) to red (high). See estimates for all 63 GWAS traits in Supplementary Fig. 8b.
d. Enrichment of eGFRcrea GWAS variants in kidney cell type-specific accessible regions. X-axis is odds ratio, and y-axis is strength of enrichment -log10(p value of two-sided chi-square test). Dot size represents the number of variants overlapping with differentially accessible regions in given cell type.
e. GWAS variant target genes prioritized by Cicero co-accessibility. Upper panel is schematic representation of target gene prioritization using Cicero connections. Lower panel indicates 1,024 target genes (x-axis) ordered by number of prioritized variants (y-axis).
f. Upper panel. LocusZoom plot of eGFRcrea GWAS associations (n = 1,508,659 individuals) at the UMOD locus. Y-axis is strength of association -log10(p value calculated using z statistic from GWAS meta-analysis). The top variant (rs12917707) tagging the independent signal closest to UMOD was selected as the index variant to calculate LD (r2) with other variants, represented from low (blue) to high (red). Lower panel includes meQTL, eQTL, eGFRcrea GWAS variants, Cicero connections, snATAC-seq chromatin accessibility, histone modifications by ChIP-seq, and chromatin states.
