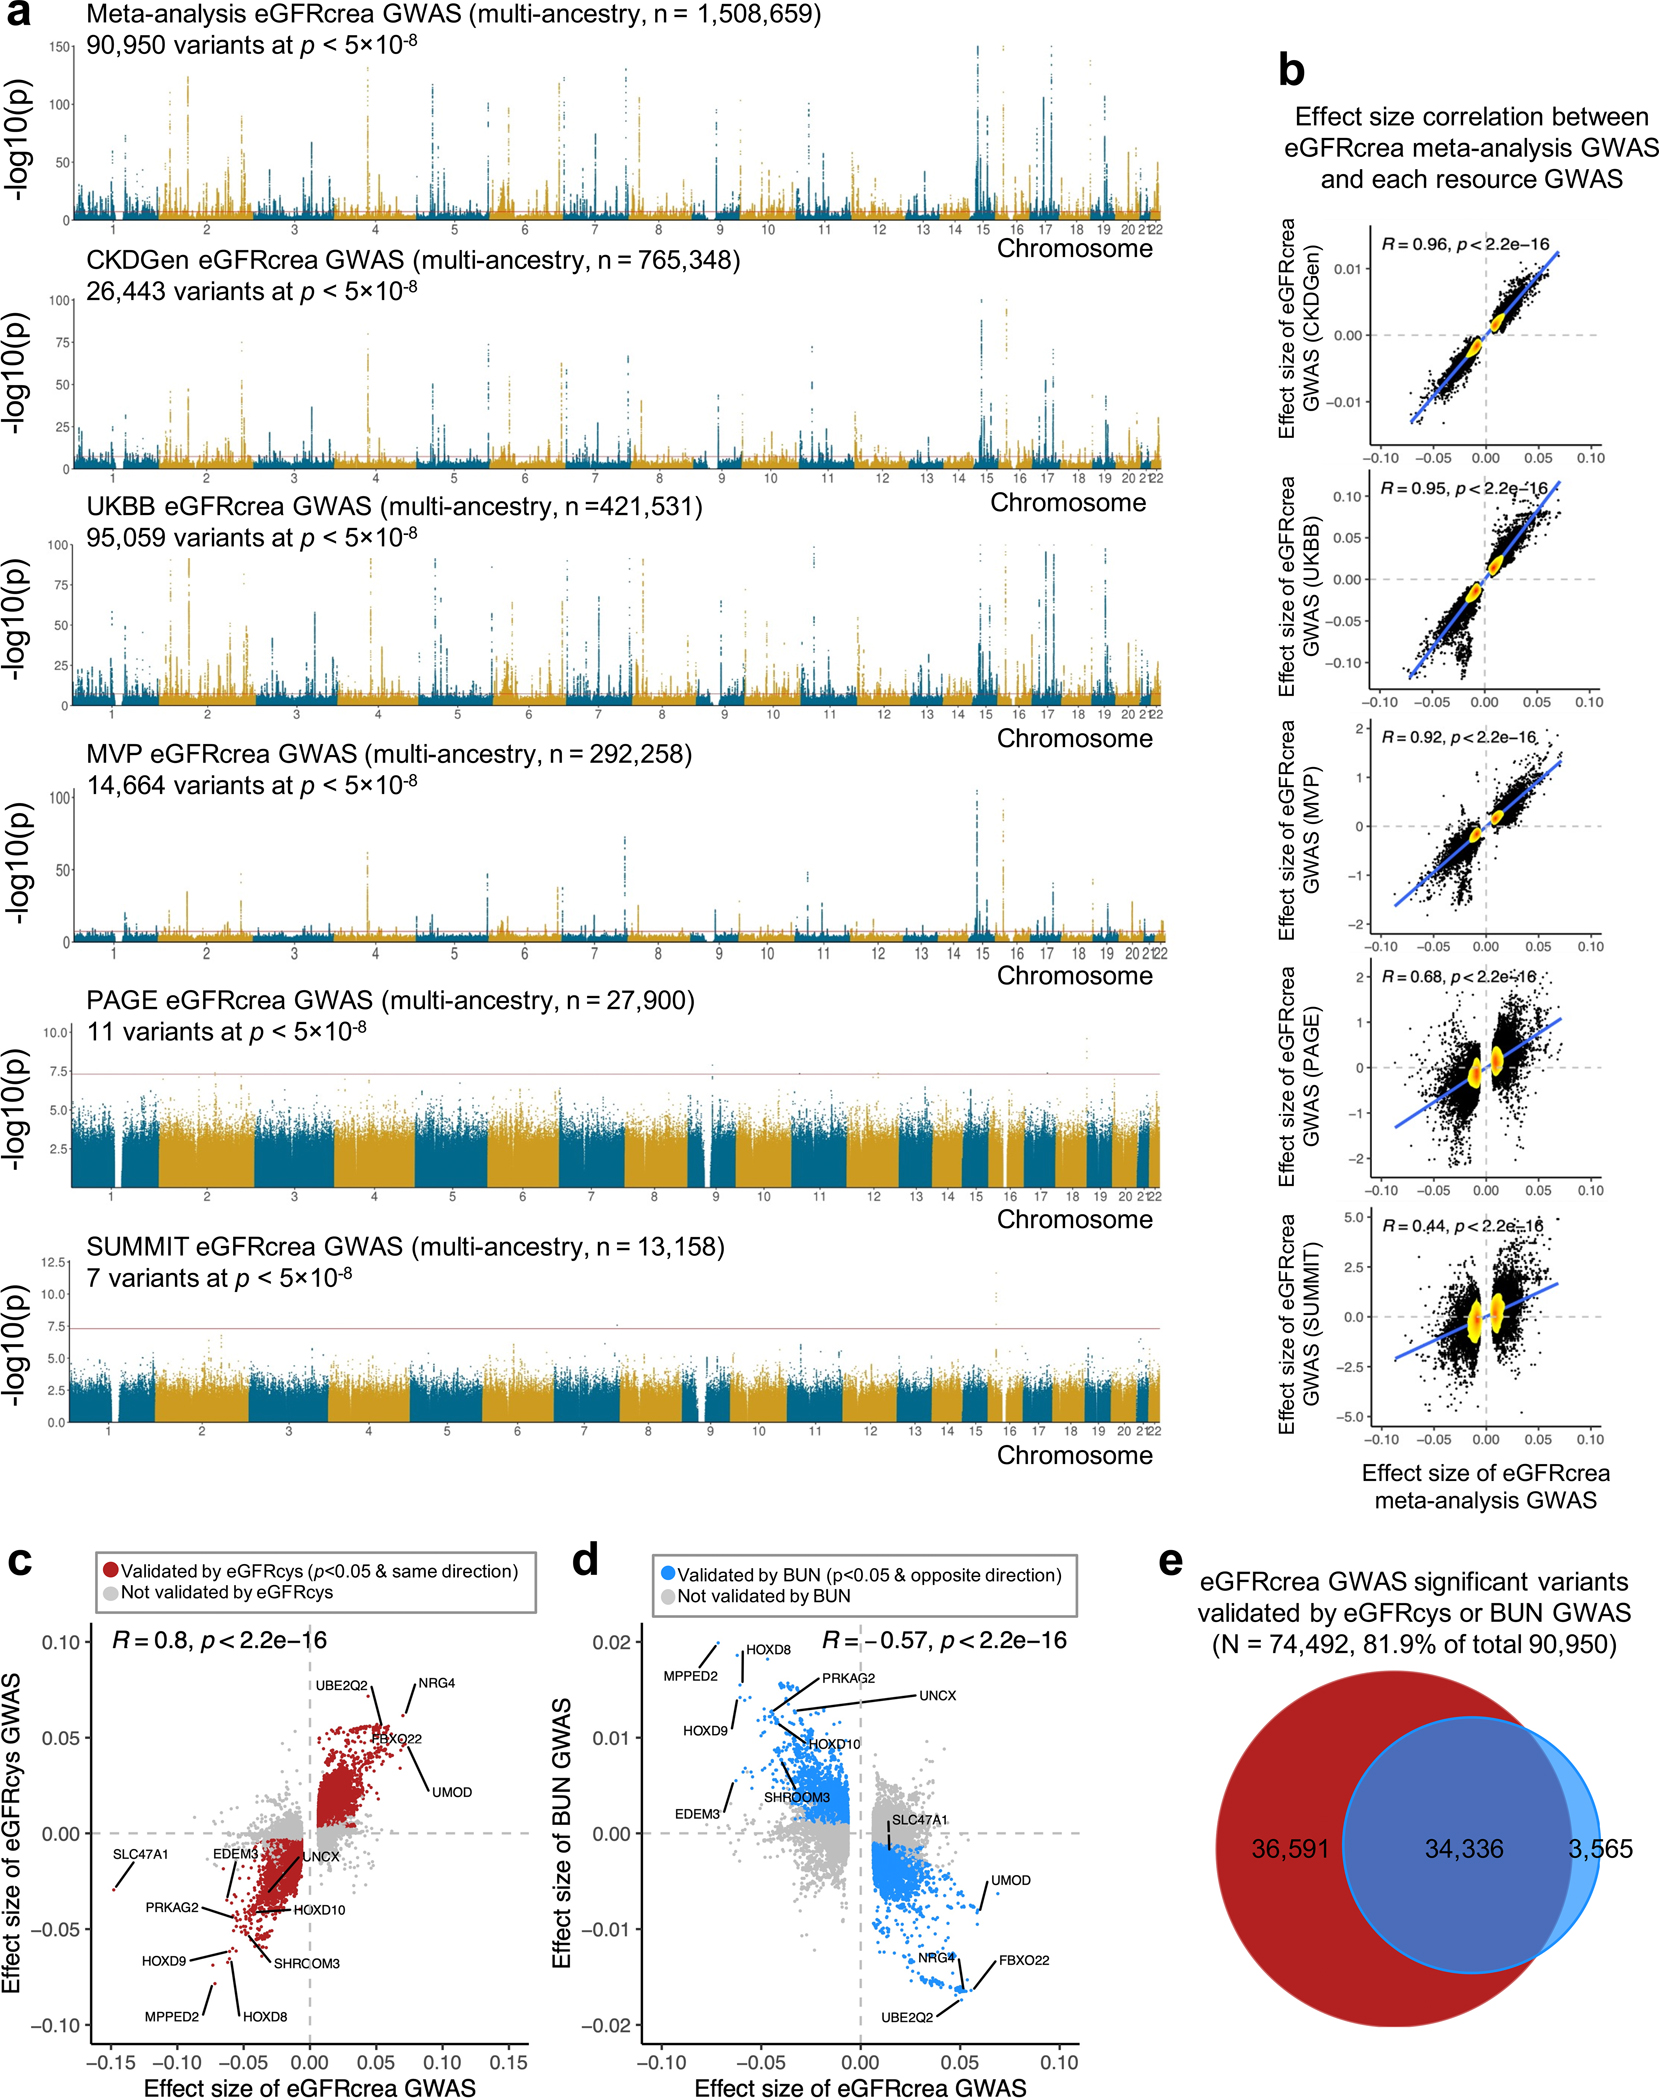
Extended_Data_Fig 1. Meta-analysis of eGFRcrea GWAS and validation using eGFRcys and BUN GWAS.

a. Manhattan plots of meta-analysis eGFRcrea GWAS (N=1,508,659 individuals) and eGFRcrea GWAS datasets including CKDGen, UKBB, MVP, PAGE and SUMMIT. For each panel, the x-axis is chromosomal location of SNP. The y-axis strength of association -log10(p). The two-sided p value was obtained from GWAS studies.
b. Scatter plot of effect size correlation between meta-analysis eGFRcrea GWAS (x-axis) and five source eGFRcrea GWAS data from CKDGen, UKBB, MVP, PAGE and SUMMIT (y-axis). The density of dots from low to high are shown from yellow to red. Correlation coefficient was calculated using Spearman's rho (R) statistic and two-sided p value was calculated using asymptotic t approximation.
c. Scatter plot of effect sizes between eGFRcrea GWAS (N=1,508,659 individuals) and eGFRcys GWAS (N=421,714 individuals). Significant eGFRcrea GWAS variants passing two-sided p < 5×10⁻⁸ in this study were used for the plot. Red dots represent validated variants showing nominally significant (two-sided GWAS p < 0.05) association with eGFRcys in the same effect direction. Correlation coefficient was calculated using Spearman's rho (R) statistic and two-sided p value was calculated using asymptotic t approximation.
d. Scatter plot of effect sizes between eGFRcrea GWAS (N=1,508,659 individuals) and BUN GWAS (N=852,678 individuals). Significant eGFRcrea GWAS variants passing two-sided p < 5×10⁻⁸ in this study were used for plot. Blue dots represent validated variants showing nominally significant (two-sided GWAS p < 0.05) association with BUN in the opposite effect direction. Correlation coefficient was calculated using Spearman's rho (R) statistic and two-sided p value was calculated using asymptotic t approximation.
e. Venn plot of eGFRcrea GWAS significant variants validated by eGFRcys GWAS or BUN GWAS. Y-axis is strength of GWAS association -log10(p value based of z statistic).
