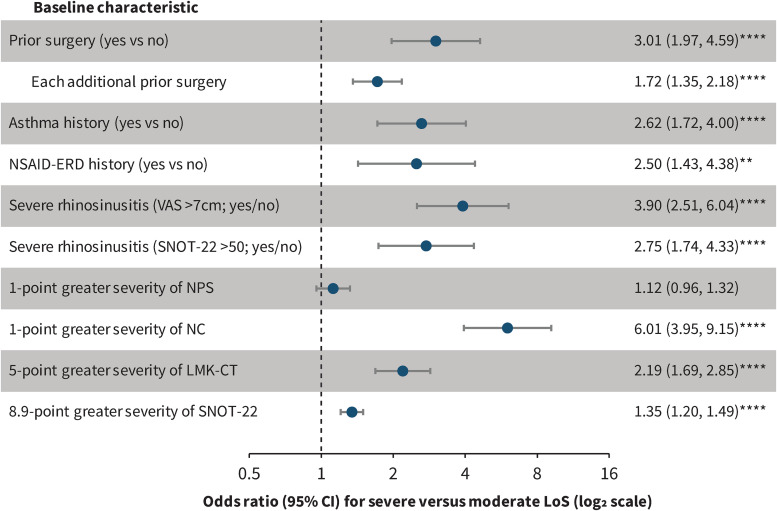
Figure 1.
Odds ratios for baseline severe versus moderate LoS by other baseline characteristics.
Note: CI, confidence interval; LMK-CT, Lund-Mackay CT-scan score; LoS, loss of smell; NC, nasal congestion/obstruction score; NPS, nasal polyp score; NSAID-ERD, nonsteroidal antiinflammatory drug-exacerbated respiratory disease; SNOT-22, 22-item Sinonasal Outcome Test; VAS, visual analog scale.
**P < .01; ****P < .0001.

