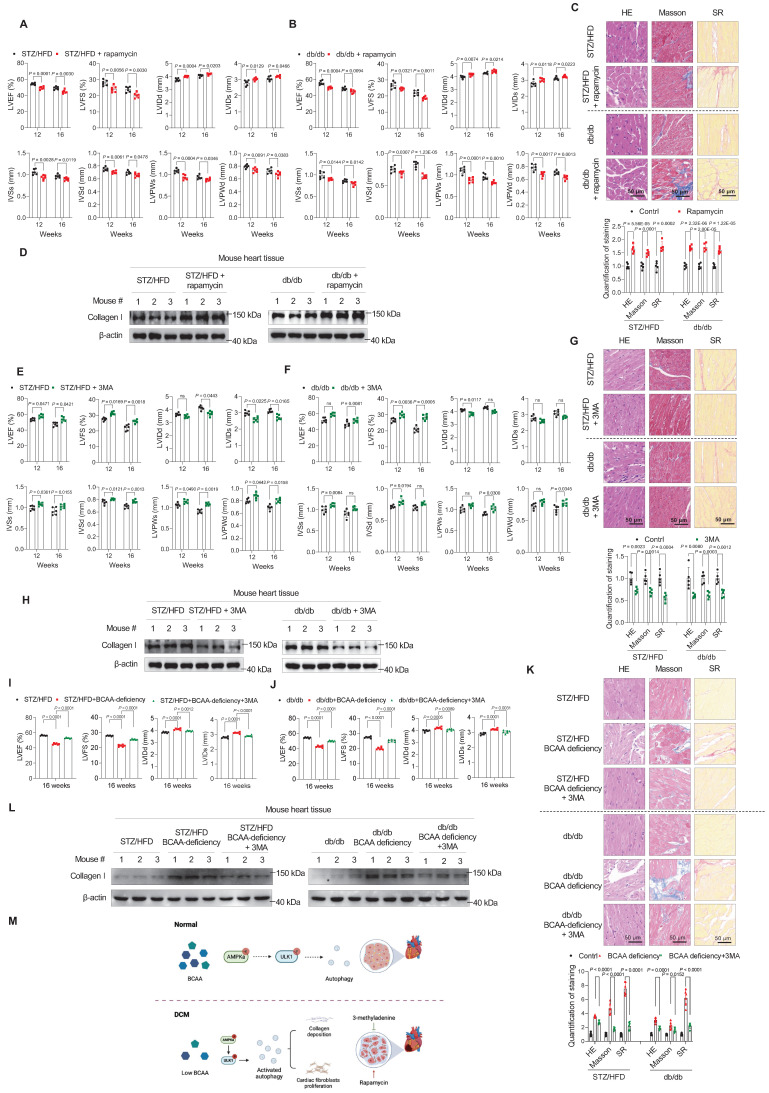
Figure 5.
Autophagy inhibition relieves, whereas autophagy activation aggravates, diabetic cardiomyopathy phenotypes. A,B, Echocardiography analysis illustrating the worsened heart function in STZ/HFD (A) and db/db (B) T2D mice after gavage of rapamycin (n = 6 mice in each group). C, Hematoxylin and eosin, Masson's trichome, and Sirius Red staining of heart tissues in T2D mice after gavage of rapamycin. The image quantification is shown on the below (n = 5 mice in each group). D, Western blot analysis of Collagen I expression in T2D mice after gavage of rapamycin (n = 3 in each group). E,F, Echocardiography analysis illustrating the restored heart function in STZ/HFD (E) and db/db (F) T2D mice after gavage of 3-methyladenine (n = 6 mice in each group). G, Hematoxylin and eosin, Masson's trichome, and Sirius Red stainings of heart tissues in T2D mice after gavage of 3-methyladenine. The image quantification is shown on the below (n = 5 mice in each group). H, Western blot analysis of Collagen I expression in T2D mice after gavage of 3-methyladenine (n = 3 in each group). I,J, Echocardiography analysis illustrating the restored heart function in STZ/HFD (I) and db/db (J) BCAA-deficient mice after gavage of 3-methyladenine (n = 6 mice in each group). K, Hematoxylin and eosin, Masson's trichome, and Sirius Red stainings of heart tissues in BCAA-deficient mice after gavage of 3-methyladenine. The image quantification is shown on the below (n = 6 mice in each group). L, Western blot analysis of Collagen I expression in BCAA-deficient mice after gavage of 3-methyladenine (n = 3 in each group). M, Schematic showing that autophagy inhibition relieves, whereas autophagy activation aggravates, DCM phenotypes. Data are expressed as mean±SEM. The nonparametric two-tailed Student's t-test was used to compare groups. Significance is indicated as nsP > 0.05, *P < 0.05, **P < 0.01, ***P < 0.001, and ****P < 0.0001.

