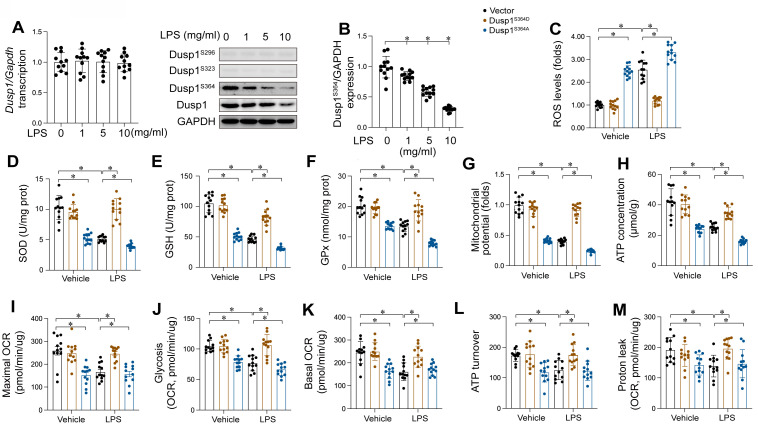
Figure 7.
LPS induced Dusp1 downregulation through suppressing Dusp1 phosphorylation. WT mice were injected with lipopolysaccharide (LPS) at 10 mg/kg for 48 hrs to induce an endotoxemia myocardial model. HL-1 cells were treated with LPS at 10 μg/mL for 24 hrs. A. qPCR analysis of Dusp1 transcription in heart tissues at different doses of LPS. B. Proteins were isolated from heart tissues and the western blots were used to analyze the expression of p-Dusp1Ser296, p-Dusp1Ser323, and p-Dusp1Ser364. C. Mitochondrial ROS were measured via immunofluorescence. D-F. ELISA kits were used to measure the concentration of GSH, GPX and SOD in HL-1 cells upon LPS exposure. G. Mitochondrial membrane potential was determined by JC-1 probe. H. ATP production was measured by ELISA in HL-1 cells upon LPS exposure. I-M. Seahorse XF Analyzer was used to measure the mitochondrial oxygen consumption rates (OCR). Experiments were repeated at least three times. Data are shown as mean ± SEM. In each group, four animals or four independent cell isolations were used. Each experiment was conducted with three replicates and the dots in each panel represent the outcomes of these replicate experiments. *p<0.05.

