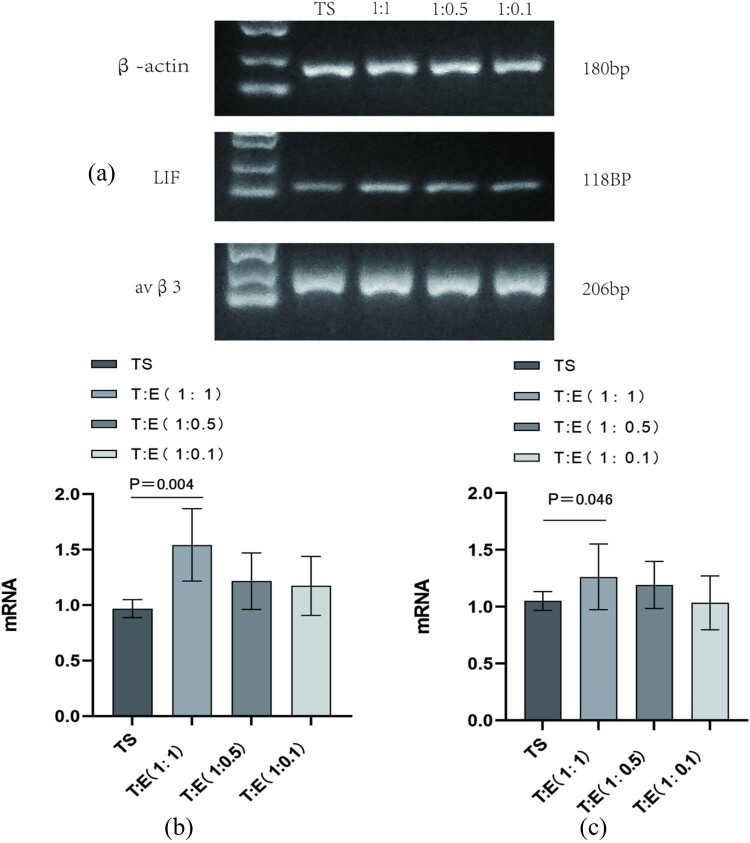
Figure 1.
(a) and (b) Compared with the tubal mucosal cell alone culture group (control group), avβ3 expression was higher in the tubal mucosal cell and endometrial cell (1:1) co-culture group (experimental group 1), P < 0.05, with statistical differences. (a) and (c) (1:0.5, 1:0.1) Co-culture (experimental groups 2 and 3) avβ3 expression P > 0.05, without statistical difference. TE: tubal mucosal cell and endometrial cell; TS: tubular mucosal cells single.

