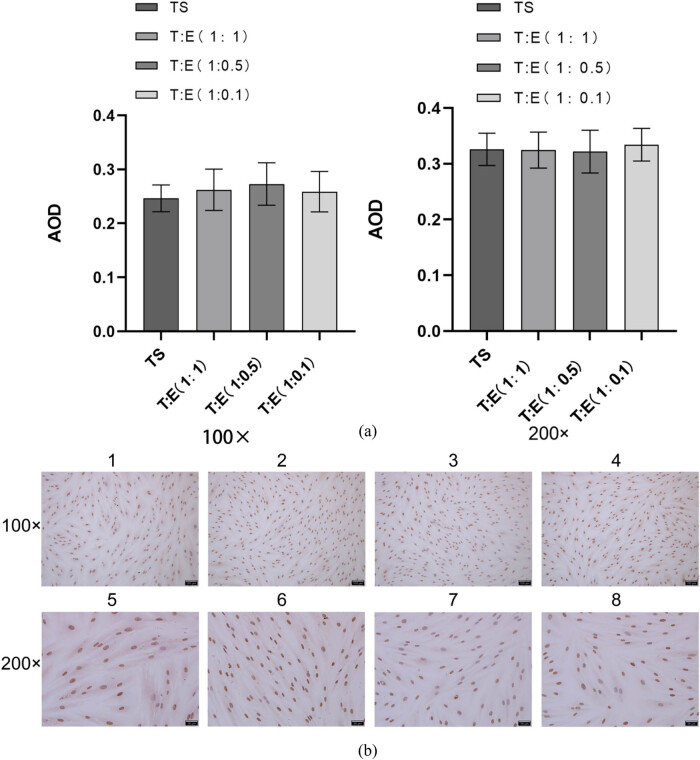
Figure 4.
Immunohistochemical assay to detect ER expression in each group of cells. (a) Quantitative comparison of mean optical density values (AOD) of ER expression in each group of cells. (b) Immunohistochemical results of ER in each group of cells, blue is the nucleus and tan or brown is the target protein expression. Intrauterine adhesions: IUAs; PCR: polymerase chain reaction; ELISA: enzyme-linked immunosorbent assay; LIF: leukemia inhibitory factor; ER: estrogen receptor; TE: tubal mucosal cell and endometrial cell; TS: tubular mucosal cells single.

