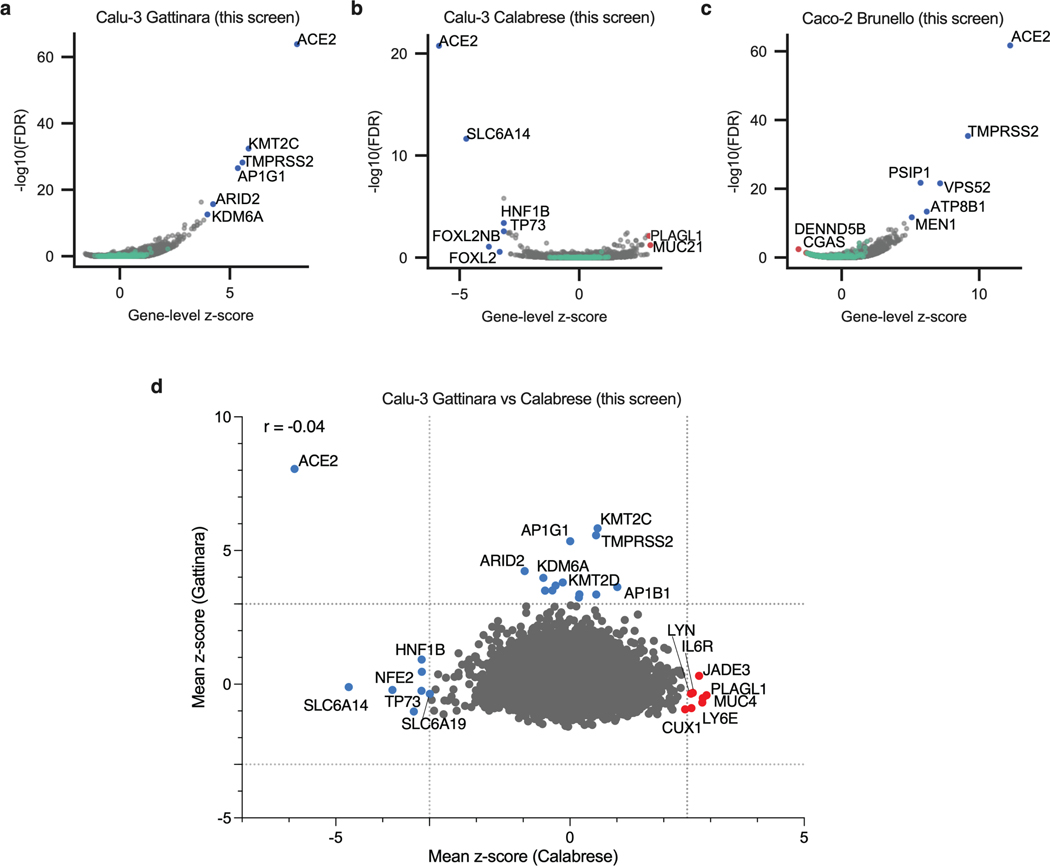
Extended Data Fig. 2. Genome-wide CRISPR KO and CRISPRa screens in Calu-3 and Caco-2 cells.
a. Volcano plot showing the top genes conferring resistance (right, blue) to SARS-CoV-2 when knocked out in Calu-3 cells. Controls are indicated in green. This screen did not have any sensitization hits. The gene-level z-score and –log10(FDR) were calculated after averaging across replicates. (n = 20,513). b. Volcano plot showing the top genes conferring resistance (right, red) and sensitivity (left, blue) to SARS-CoV-2 when overexpressed in Calu-3 cells. Controls are indicated in green. The gene-level z-score and –log10(FDR) were calculated after averaging across replicates. (n = 20,494). c. Volcano plot showing the top genes conferring resistance (right, blue) and sensitivity (left, red) to SARS-CoV-2 when knocked out in Caco-2 cells. Controls are indicated in green. The gene-level z-score and –log10(FDR) were calculated after averaging across replicates. (n = 18,804). d. Comparison between gene hits in Calu-3 KO and activation screens. Dotted lines indicated mean z-scores of -3 and 2.5 or 3 for each screen. Proviral and antiviral genes are indicated in blue and red, respectively. Pearson’s correlation coefficient r is indicated. (n = 18,173).

