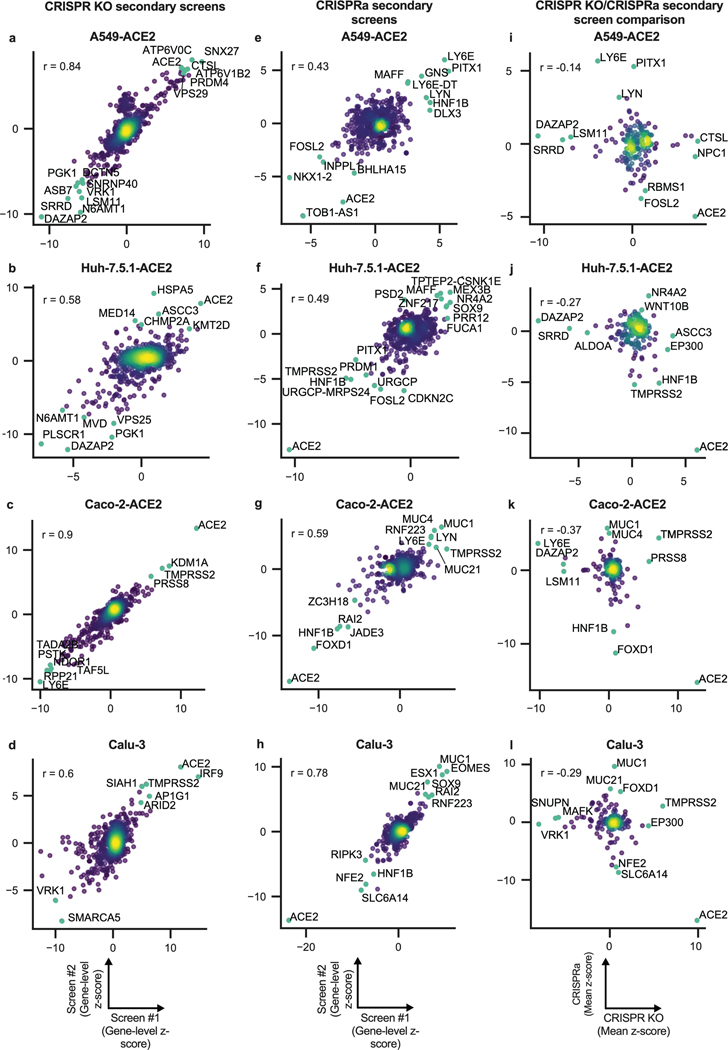
Extended Data Fig. 3. Secondary screens in A549-ACE2, Huh7.5.1-ACE2, Caco-2-ACE2 and Calu-3 cells.
a-d. Scatter plots showing gene-level z-scores for each secondary activation screen with top resistance and sensitization hits annotated (A549-ACE2, Huh7.5.1-ACE2, Caco-2-ACE2 and Calu-3, respectively). Pearson’s correlation coefficient, r, is labeled (n = 677, each). e-h. Scatter plots showing gene-level z-scores for each secondary activation screen with top resistance and sensitization hits annotated (A549-ACE2, Huh7.5.1-ACE2, Caco-2-ACE2 and Calu-3, respectively). Pearson’s correlation coefficient, r, is labeled (n = 820, each). i-l. Scatter plots showing mean z-scores comparing each secondary activation screen to each secondary KO screen for each cell line with top resistance and sensitization hits annotated (A549-ACE2, Huh7.5.1-ACE2, Caco-2-ACE2 and Calu-3). Pearson’s correlation coefficient, r, is labeled (n = 179, each).

