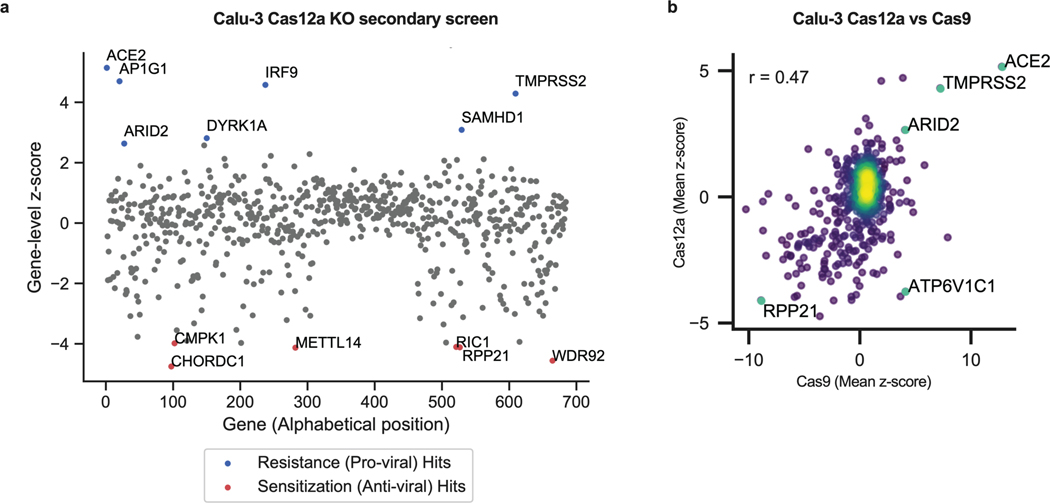
Extended Data Fig. 4. Secondary KO screen in Calu-3-Cas12a cells and comparison with Cas9-based screens.
a. Scatter plot showing the gene-level z-scores of genes when knocked out using Cas12a in Calu-3 cells. The top genes conferring resistance to SARS-CoV-2 are annotated and shown in blue. The top genes conferring sensitivity to SARS-CoV-2 are annotated and shown in red. (n = 684). Only one replicate is shown as the second replicate had low sequencing quality. b. Scatter plots showing mean z-scores comparing each Cas9 to Cas12a secondary KO screens for Calu-3 cells with top resistance and sensitization hits annotated. Pearson correlation, r, labeled (n = 600 each).

