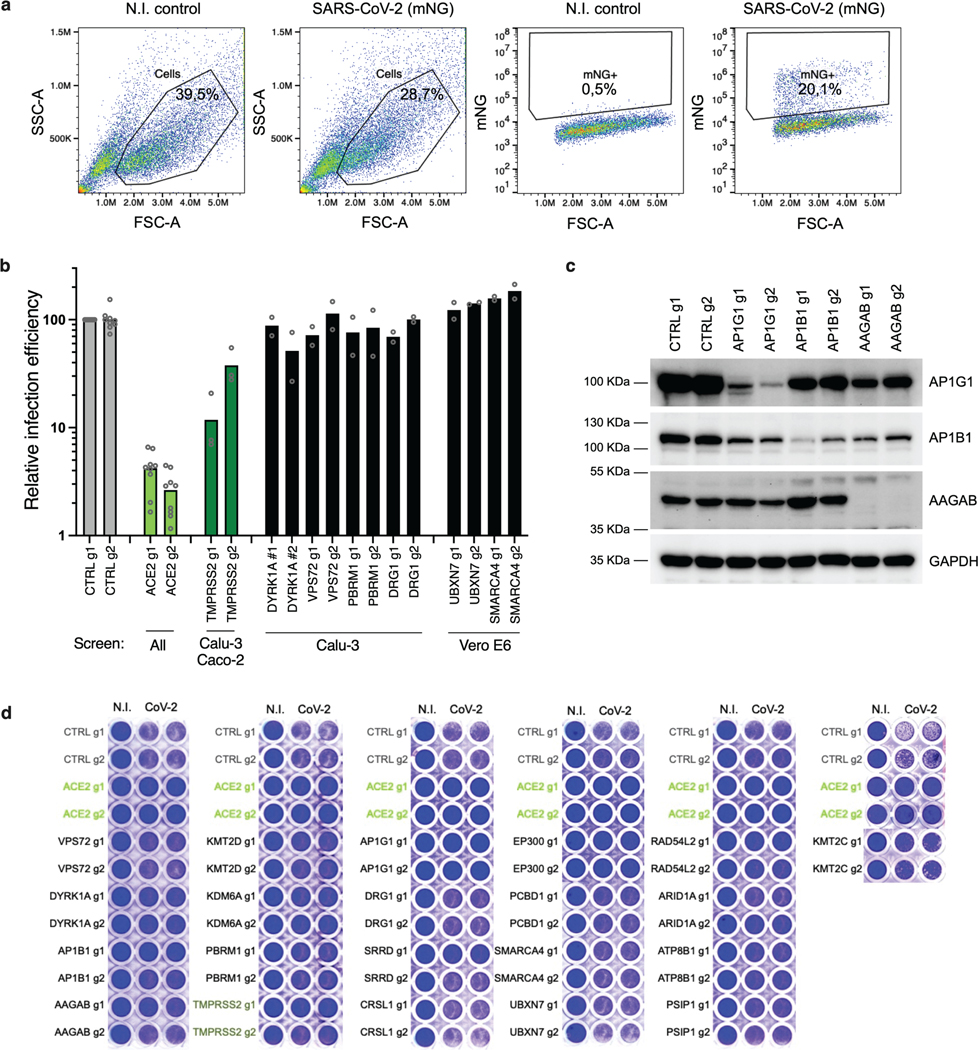
Extended Data Fig. 5. Proviral gene candidate validation in Calu-3 cells.
a. Gating strategy for flow cytometry analysis. Pseudocolored dot-plots of sorted Calu-3 cells, showing gates used for the analysis in Fig. 3a (and all figures using flow cytometry analysis). b. Impact of additional candidate gene KO (panel complementary to Fig. 4a). Calu-3-Cas9 cells were stably transduced to express 2 different sgRNAs (g1, g2) per indicated gene and selected. Cells were infected with SARS-CoV-2 bearing the mNeonGreen (mNG) reporter and the infection efficiency was scored 48 h later by flow cytometry. The cell line/screen in which the candidates were identified is indicated below the graph; data from 2 independent experiments are shown. c. AP1G1, AP1B1, and AAGAB depletion efficiency in Calu-3 KO cell populations. A representative immunoblot is shown out of 3 independent experiments; GAPDH serves as a loading control. d. SARS-CoV-2-induced cytopathic effects in KO cell lines. Calu-3-Cas9 cells were stably transduced to express 2 different sgRNAs (g1, g2) per indicated gene and selected. Cells were infected by SARS-CoV-2 at MOI 0.005 and ~5 days later stained with crystal violet. Representative images out of 2 independent experiments are shown.

