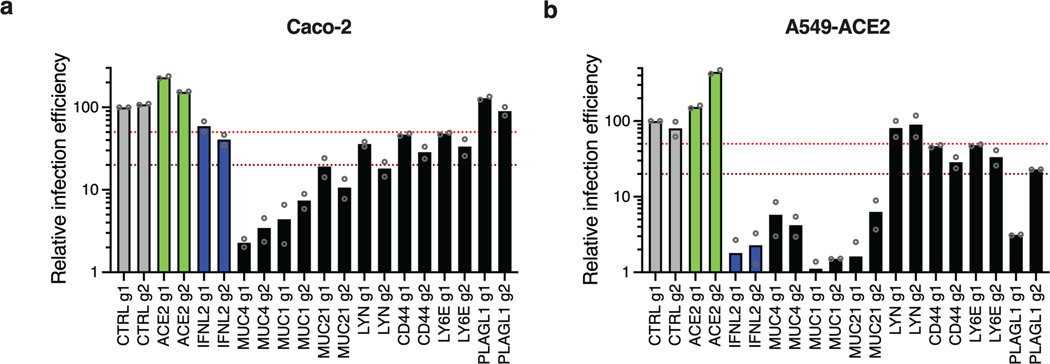
Extended Data Fig. 8. Impact of the identified antiviral genes on SARS-CoV-2 in Caco-2 and A549-ACE2 cells.
Caco-2-dCas9-VP64 (a) and A549-ACE2-dCas9-VP64 (b) cells were stably transduced to express 2 different sgRNAs (g1, g2) per indicated gene promoter, or negative controls (CTRL) and selected prior to SARS-CoV-2 mNG infection. The percentage of infected cells was scored 48 h later by flow cytometry. The mean of relative infection efficiencies are shown for 2 independent experiments. The red and dark red dashed lines represent 50% and 80% inhibition, respectively.

