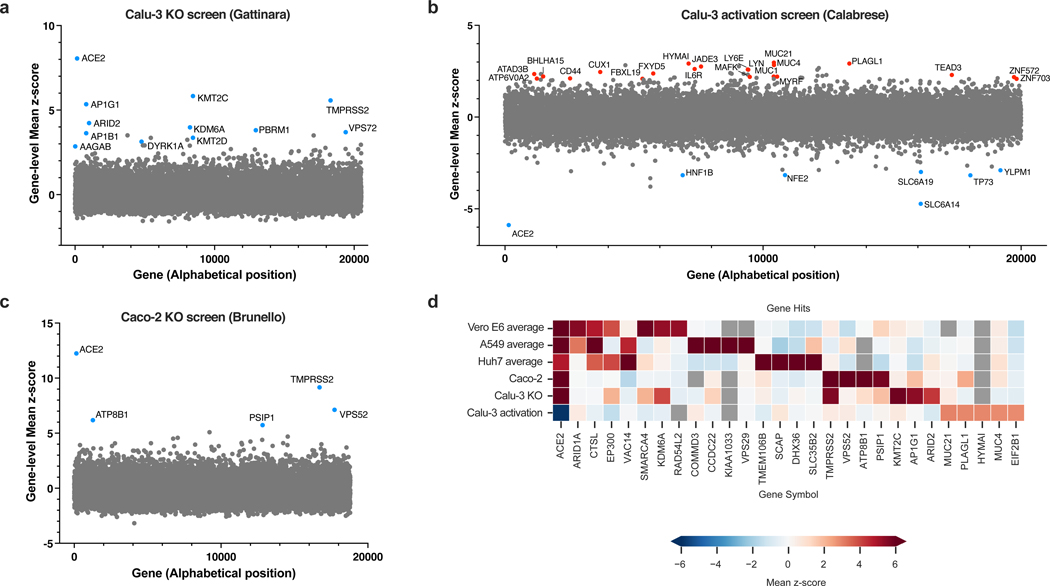
Fig. 2. Genome-wide CRISPR screens in Calu-3 reveal new regulators of SARS-CoV-2.
a. Scatter plot showing the gene-level mean z-scores of genes when knocked out in Calu-3 cells. The top genes conferring resistance to SARS-CoV-2 are annotated and shown in blue. This screen did not have any sensitization hits. (n = 20,513). b. Scatter plot showing the gene-level mean z-scores of genes when overexpressed in Calu-3 cells. The top genes conferring resistance and sensitivity to SARS-CoV-2 are annotated and shown in red and blue, respectively. (n = 20,000). c. Scatter plot showing the gene-level mean z-scores of genes when knocked out in Caco-2 cells. The top genes conferring resistance to SARS-CoV-2 are annotated and shown in blue. (n = 18,804). d. Heatmap of top 5 resistance hits from each cell line after averaging across screens in addition to genes that scored in multiple cell lines based on the criteria used to construct the Venn diagram in Fig. 1d (based on 16–21 and this study). Grey squares indicate genes that were filtered out for that particular cell line due to number of guides targeting that gene (see Methods).

