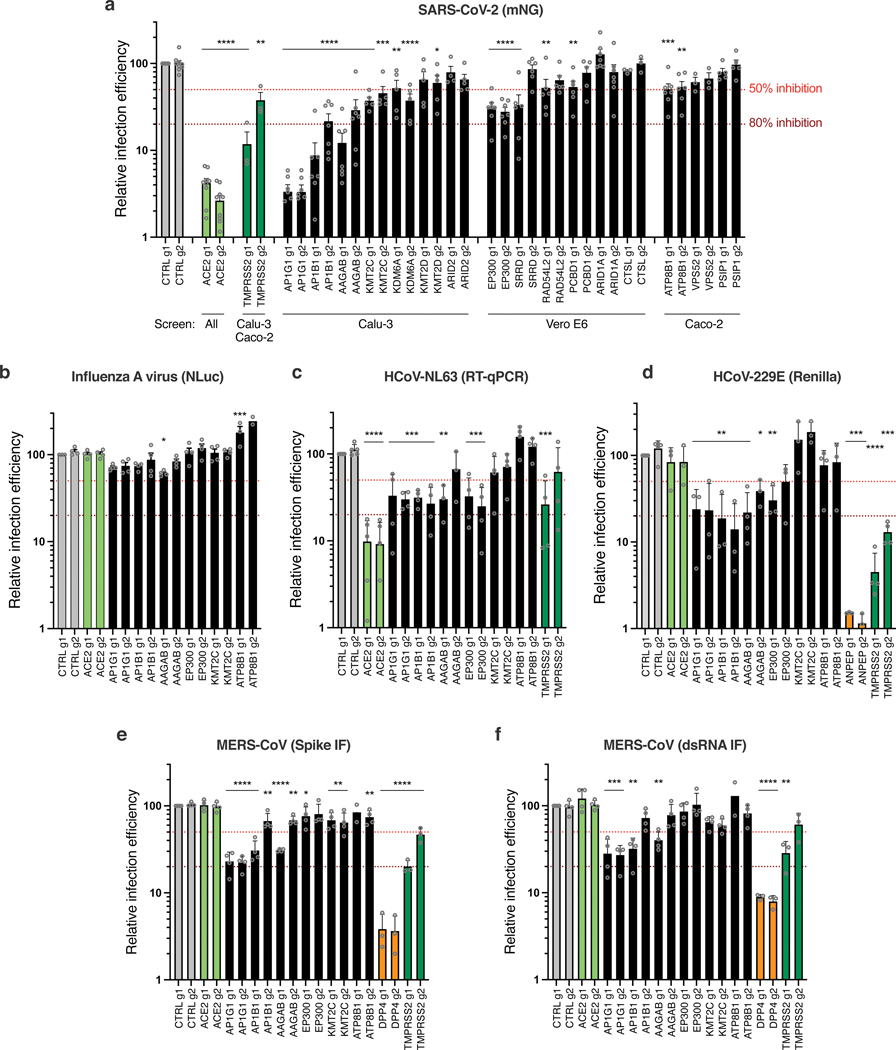
Fig. 4. Impact of the identified proviral genes on coronaviruses SARS-CoV-2, HCoV-229E, HCoV-NL63, MERS-CoV and on orthomyxovirus influenza A.
Calu-3-Cas9 cells were stably transduced to express 2 different sgRNAs (g1, g2) per indicated gene and selected. a. Cells were infected with SARS-CoV-2 bearing the mNeonGreen (mNG) reporter and the infection efficiency was scored 48h later by flow cytometry. The cell lines/screens in which the candidates were identified are indicated below the graph. b. Cells were infected with influenza A virus bearing the Nanoluciferase (NLuc) reporter and 10h later, relative infection efficiency was measured by monitoring NLuc activity. c. Cells were infected with HCoV-NL63 and 5 days later, relative infection efficiency was determined using RT-qPCR. d. Cells were infected with HCoV-229E-Renilla and 48–72h later, relative infection efficiency was measured by monitoring Renilla activity. e-f. Cells were infected with MERS-CoV and 16h later, the percentage of infected cells was determined using anti-Spike (e) or anti-dsRNA (f) immunofluorescence (IF) staining followed by microscopy analysis (n=10 fields per condition). The mean and SEM of ≥ 3 independent experiments are shown (a-f; except in b for ATP8B1 g2, and in e and f for ATP8B1 g1, n=2). Statistical significance was determined with one-way ANOVA with Dunnett’s test (* p<0.05, ** p<0.01, *** p<0.001, **** p<0.0001) (a-f). Exact n numbers and p-values are indicated in Supplementary Data 17. The red and dark red dashed lines represent 50% and 80% inhibition, respectively.

