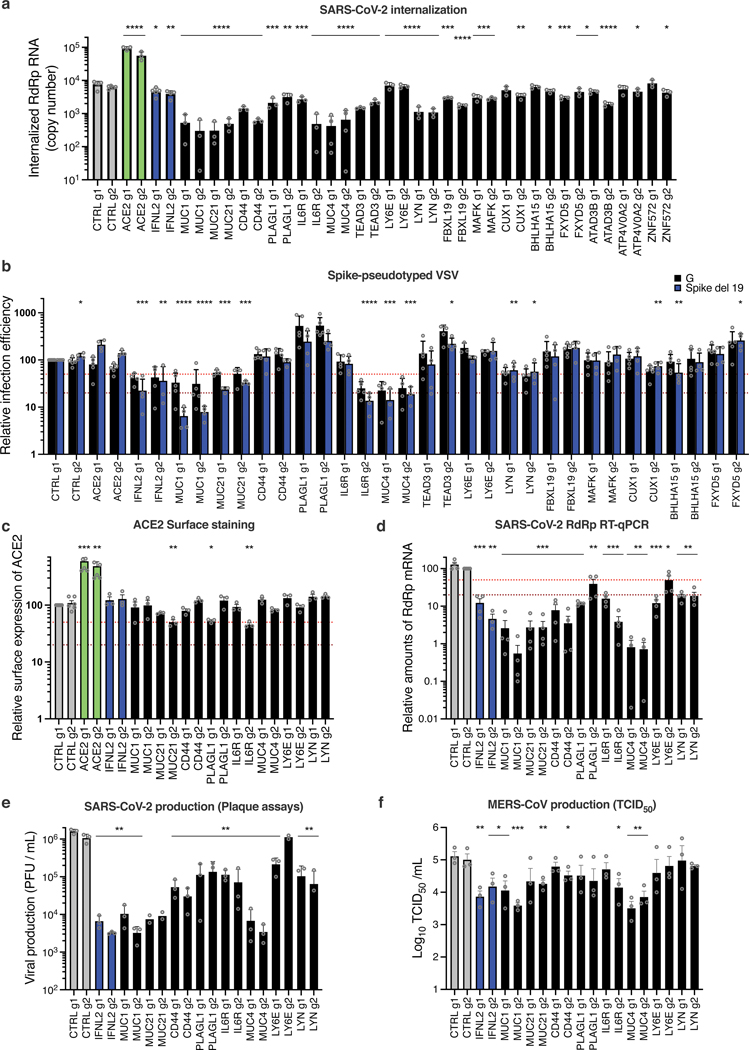
Fig. 7. Characterization of the impact of identified SARS-CoV-2 antiviral factors.
Calu-3-dCas9-VP64 cells were stably transduced to express 2 different sgRNAs (g1, g2) per indicated gene promoter and selected for 10–15 days. a. Cells were incubated with SARS-CoV-2 for 2h and then treated with Subtilisin A followed by RNA extraction and RdRp RT-qPCR analysis. b. Cells were infected with Spike del19 and VSV-G pseudotyped, Firefly-expressing VSV and infection efficiency was analyzed 24h later by monitoring Firefly activity. c. Relative surface ACE2 expression was measured using a Spike-RBD-mFc fusion and a fluorescent secondary antibody followed by flow cytometry analysis. d. Cells were infected with SARS-CoV-2 and, 24h later, lysed for RNA extraction and RdRp RT-qPCR analysis. e. Aliquots of the supernatants from d were harvested and plaque assays were performed to evaluate the production of infectious viruses in the different conditions. f. Cells were infected with MERS-CoV and 16h later, infectious particle production in the supernatant was measured by TCID50. The mean and SEM of ≥ 3 independent experiments are shown (a, c, d, e, f; except for e, MUC21 and LY6E g2 KO, n=2). Statistical significance was determined by a two-sided t-test with no adjustment for multiple comparisons (* p<0.05, ** p<0.01, *** p<0.001, **** p<0.0001) (a-f). Exact n numbers and p-values are indicated in Supplementary Data 17. The red and the dark red (b, c, d) dashed lines represent 50% and 80% inhibition, respectively.

