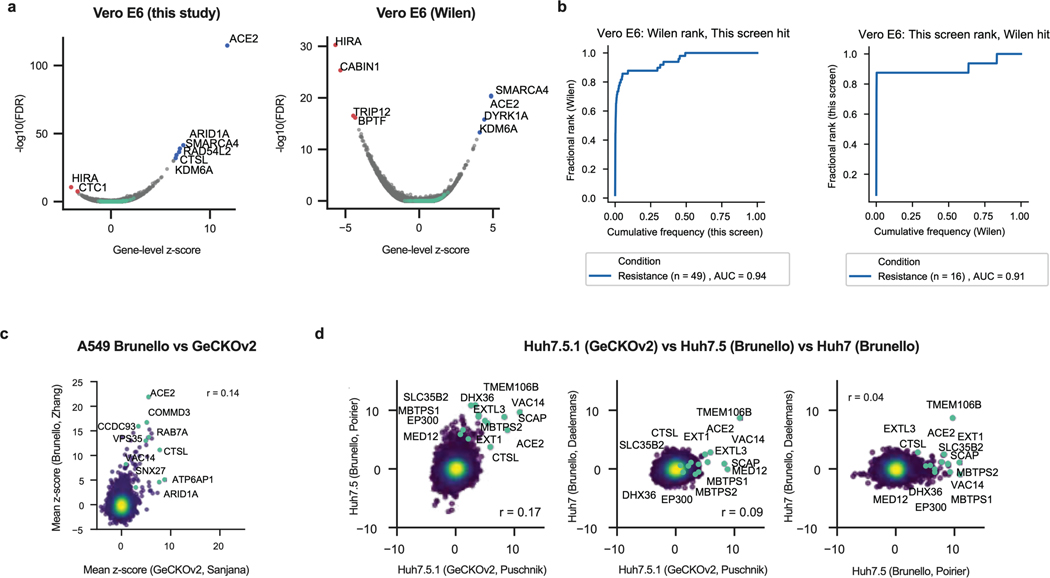
Extended Data Fig. 1. Meta-analysis of genome-wide screens.
a. Volcano plot showing the top genes conferring resistance (right, blue) and sensitivity (left, red) to SARS-CoV-2 when knocked out in Vero E6 cells for this screen (left panel) and the screen conducted by Wei et al. 2021 (Wilen20; right panel). Controls are indicated in green. The gene-level z-score and -log10(FDR) were calculated after averaging across conditions (of note, the FDR value for ACE2 is effectively zero but has been assigned a -log(FDR) value for plotting purposes). (n = 20,928 for each plot). b. Cumulative distribution plots analyzing overlap of top hits between this screen and the Wilen screen. Left panel: Putative hit genes from the Wilen screen are ranked by mean z-score, and classified as validated hits based on mean z-score in the secondary screen, using a threshold of greater than 3. Right panel: Putative hit genes from this screen are ranked by mean z-score, and classified as validated hits based on mean z-score in the Wilen screen, using a threshold of greater than 3. c. Comparison between genome-wide screens conducted in A549 cells overexpressing ACE2 by Daniloski et al. (Sanjana17) and Zhu et al. (Zhang21) using the GeCKOv2 and Brunello libraries, respectively. Pearson’s correlation coefficient r is indicated. (n = 18,484). d. Pair-wise comparison between genome-wide screens conducted in Huh7.5.1-ACE2-TMPRSS2, Huh7.5, and Huh7 cells by Wang et al. (Puschnik19), Schneider et al. (Poirier18), and Baggen et al. (Daelemans16), respectively, using the GeCKOv2 and Brunello libraries as indicated. Annotated genes include top 3 resistance hits from each screen as well as genes that scored in multiple cell lines based on the criteria used to construct the Venn diagram in Fig. 1d. Pearson’s correlation coefficient r is indicated. (n = 18,470 for each plot).

