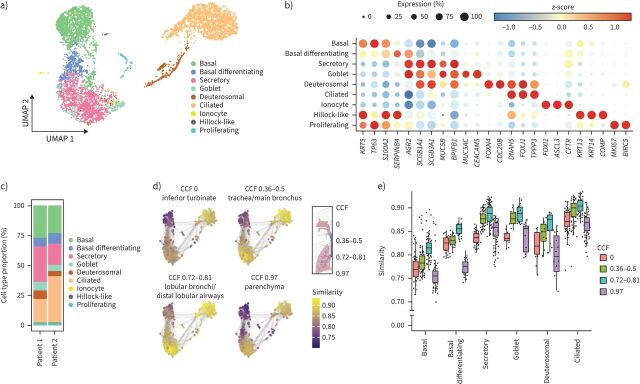
FIGURE 4.
Single-cell transcriptome profiling in the bronchioid model. a) Uniform Manifold Approximation and Projection (UMAP) representation of single-cell RNA-sequencing (scRNA-seq) transcriptomic data showing the different cell types detected in 21-day-old bronchioids from two different non-COPD donors (Patients 1 and 2). b) Dot plot showing scaled mean expression (colour) and percentage of expressing cells (dot size) of selected marker genes in the indicated cell groups. c) Relative abundance of cell types identified in bronchioids from Patients 1 and 2. d) Bronchioid neighbourhoods, positioned with respect to the UMAP embedding of each index cell, are coloured by the maximum correlation value across primary lung tissue neighbourhoods from four distinct anatomical locations based on the common coordinate framework (CCF) established in the HLCA [31]. e) Box plot depicting neighbourhood similarities of bronchioid neighbourhoods with primary lung tissue neighbourhoods in the respective CCF category over major cell types identified in the bronchioid scRNA-seq data. The centre line indicates the median, the box limits indicate the upper and lower quantiles, and the whiskers indicate 1.5× interquartile range. In d and e, the bronchioid neighbourhoods were constructed from cells integrated across the two samples.

