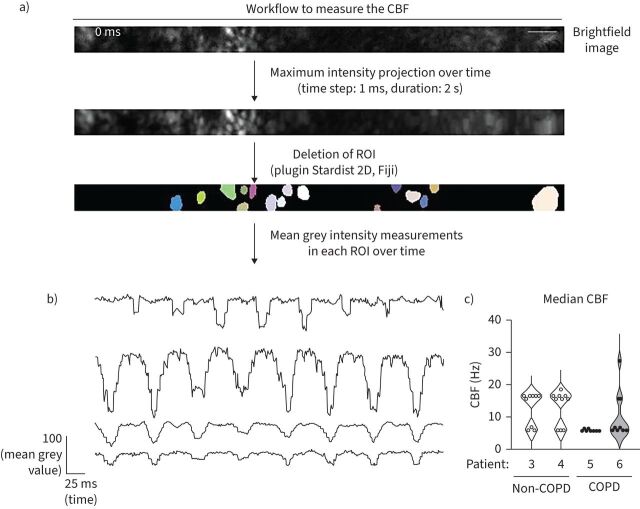
FIGURE 5.
Fast Fourier transform (FFT) analysis of ciliary movement using high-speed video microscopy analysis. a) Schematic workflow for measuring ciliary beat frequency (CBF). Representative brightfield image corresponding to a part of a bronchioid at day 20. The coloured areas correspond to the regions of interest (ROIs) determined by the plugin Stardist 2D of the Fiji software on the image generated by a maximum intensity projection over time. Scale bar: 5 µm. b) Representative measurements of the mean intensity in ROIs over time. The main frequency was determined using a FFT in each ROI. c) Violin plots showing the CBF of bronchioids derived from four different patients (non-COPD Patients 3 and 4, COPD Patients 5 and 6). For each patient, individual values represent median CBFs, determined in 9–10 fields.

