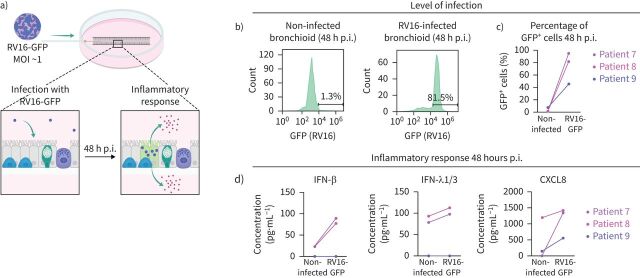
FIGURE 6.
Rhinovirus infection in the bronchioid model. a) Experimental design for testing rhinovirus type 16 (RV16)-green fluorescent protein (GFP) infection. b) Histograms showing representative cell counts (y-axis) versus GFP fluorescence (x-axis) under different conditions at 48 h post-infection (p.i.). The percentages indicate the number of GFP+ cells. c) Percentages of GFP+ cells 48 h p.i. in bronchioids from three different donors (Patients 7, 8 and 9) under non-infected and infected (RV16-GFP) conditions. d) Interferon β (IFN-β), interferon λ1/3 (IFN-λ1/3) and C-X-C motif chemokine ligand 8 (CXCL8) concentrations in the medium from bronchioid cultures under different conditions. MOI: multiplicity of infection.

