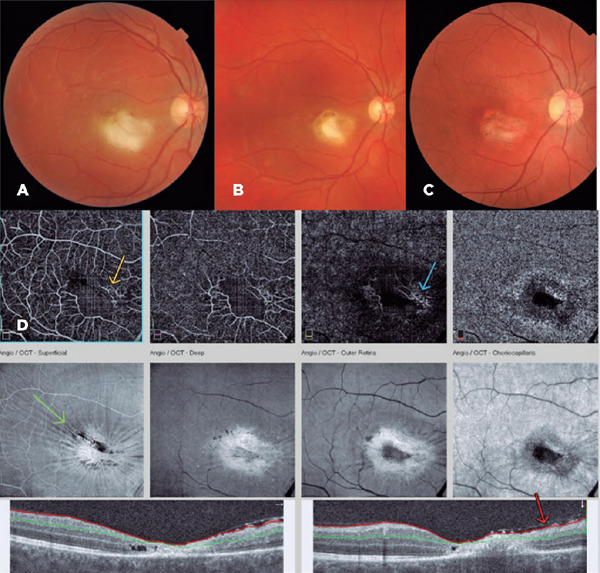
Figure 2.

Fundus Photo, optical coherence tomography (OCT), and OCT-Angiography (OCT-A). (A) Retinochoroiditis 11 weeks after infection, (B) 14 days, and (C) 40 days after treatment with sulfamethoxazole/trimethoprim. (D) OCT-A and OCT after 2 months of treatment. On the OCT-A images, a vascular void adjacent to the foveal avascular zone is visible (yellow arrow). It is compatible with the lesion’s topography. The outer retina slabs show dilated vessels on the scar’s nasal borders that could suggest increased blood flow (blue arrow). The en-face slabs display a superficial concentric distortion suggestive of an epiretinal membrane and an atrophic scar (green arrow). OCT B-scans show retinal thinning due to disruption of the retinal layers and confirm the presence of an epiretinal membrane (red arrow).
