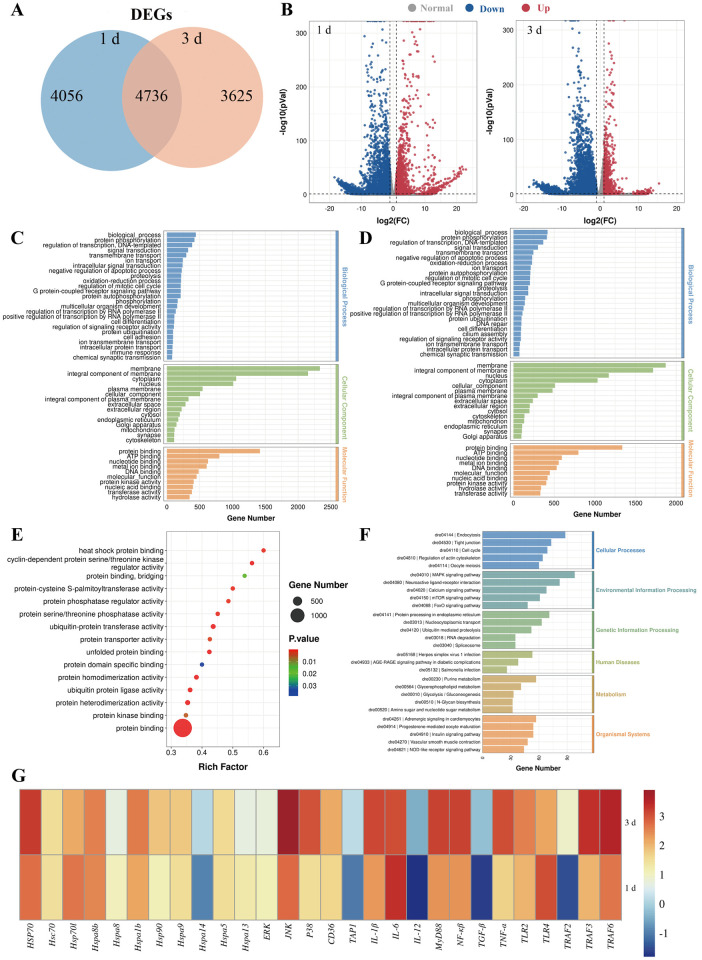
Fig 3. Transcriptome analysis provides insights into the immune response in skin.
(A) Venn diagram showing the number of the statistical results of DEGs in the skin of zebrafish at 1 and 3 dpv. (B) Volcano plot displaying the DEGs distribution of significantly upregulated (expression fold change >2 and FDR <0.05, red spots) and downregulated (expression fold change <2 and FDR <0.05, blue spots) at 1 and 3 dpv compared with control group. (C) The GO enrichment for differentially expressed genes at 1 dpv compared with control group. (D) The GO enrichment for differentially expressed genes at 3 dpv compared with control group. (E) Molecular function that were significantly altered in skin of vaccinated fish at 1 dpv compared to 3 dpv were revealed through RNA-seq studies. (F) The DEGs enrichment KEGG pathway analysis at 1 dpv compared with 3 dpv. (G) qPCR analysis on the expression of related with heat shock protein binding, MAPK signaling pathway, and immune response gene in skin from vaccinated fish at 1 and 3 dpv.

