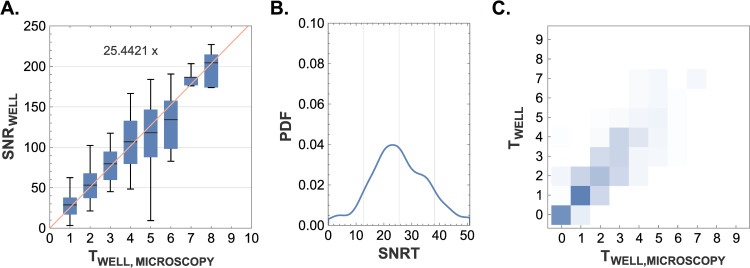
Fig 2. Validation of biocytometry using microscopy.
A) A comparison of the SNRWELL values reported by biocytometry and the target cell counts obtained by microscopic examination. The agreement validates the homogeneity in sample preparation and emphasizes the predictive power of biocytometry in capturing the true underlying distribution of cells. A conversion factor CF ∼ 25.4421 was identified by linear regression based with the least square method. B) A histogram visualizing the SNRT distribution derived from 302 HUMO sample wells evaluated by combination of biocytometry and microscopy. The alignment between the distribution (SNRT = 26.9, CV = 49.1%) and the nominal SNRT value (CF = 25.4) illustrates the reliability of biocytometry to enumerate target cells. C) Biocytometry vs microscopy confusion matrix illustrating a two-dimensional probability mass function (PMF). Higher probabilities were accentuated with more intense colors. The strong concordance between target estimates garnered via biocytometry and those obtained through microscopy underscores the reliable performance of biocytometry in estimating the number of target cells present in the sample. Any minor underestimation noted in microscopy can potentially be attributed to loss of target cells during the microscopy validation process.

