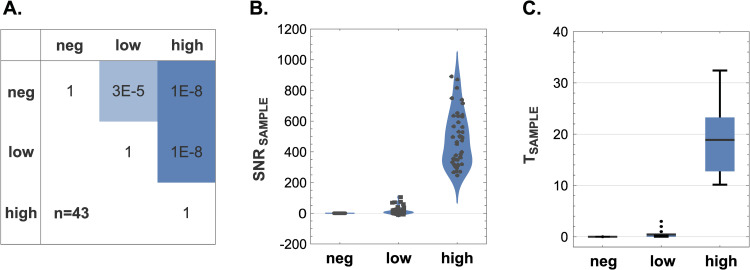
Fig 3. Discriminatory power of biocytometry.
A) A confusion matrix showcasing the p-values calculated from the Wilcoxon signed-rank test demonstrates the ability of biocytometry to differentiate between different HUMO samples with statistical significance. B) Violin charts representing the distribution of SNRSAMPLE values emphasize consistent performance of biocytometry across different HUMO samples. Average SNR values of 0.0, 15.6 and 483.6 were observed for the negative, low and high HUMO samples respectively. C) Target prediction of biocytometry is illustrated by TSAMPLE values for each HUMO sample type. Average TSAMPLE values of 0.0, 0.4 and 18.9 were observed for the negative, low and high HUMO samples respectively. Key statistical values, including means, quartiles and 5% and 95% quantiles, are represented within the box-and-whisker plots.

