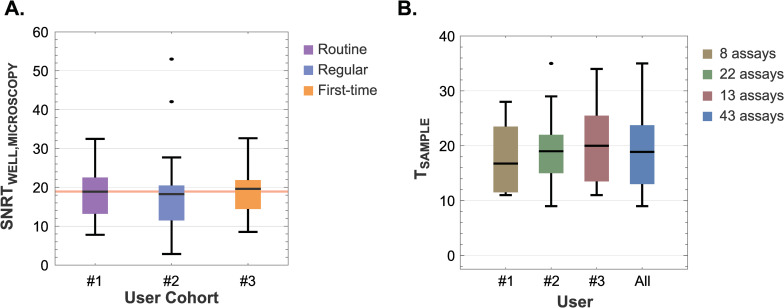
Fig 4. Assessment of inter-user reproducibility: A comparative study on SNRT values and high HUMO target estimates across different users.
A) Distribution of SNRTWELL values obtained for 137 high HUMO wells by a combination of biocytometry and microscopy across users with varying proficiency levels. Average SNRTWELL values of 18.9 (CV = 48.7%), 18.3 (CV = 60.6%), 19.6 (CV = 53.1%) were registered by the routine, regular and first-time users respectively. The consolidated mean of 19.2 (CV = 52.6%) is denoted by the red line. Key statistical values, including means, quartiles and 5% and 95% quantiles, are represented within the box-and-whisker plots. B) A comparative analysis of high HUMO sample target estimates across users confirms the consistency of biocytometry, regardless of the user performing the assay. The means are 16.8, 19.0, 20.0 and 18.9 respectively. Key statistical values, with means, quartiles, 5% and 95% quantiles and outliers are clearly indicated.

