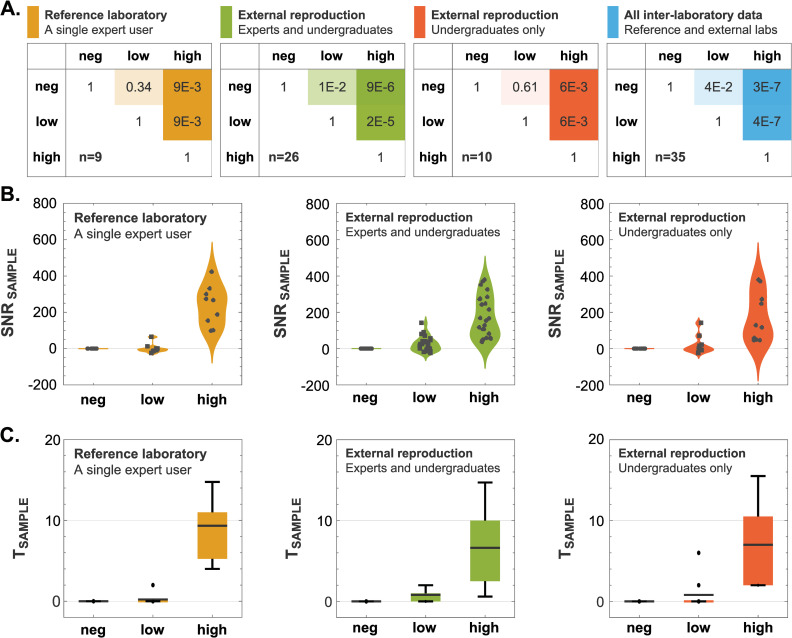
Fig 5. Discriminatory power of biocytometry across different segments of the decentralized data collection.
A) A confusion matrix analysis illustrating the discriminatory power of biocytometry across different user groups in the decentralized data collection. Mean SNR values were computed across different user groups and for different HUMO samples. Wilcoxon signed-rank tests were conducted between different HUMO samples in each user group to test the hypothesis of equal medians. The p-values are represented visually, with lower values indicating lower probability of equal medians. B) Sample SNR distributions illustrated as violin charts. Scatter plots of the actual data points were overlaid on each figure. C) Box-and-whisker plots present illustrating sample target estimate distributions. A box-and-whisker plot is displayed for each HUMO sample type and segment of the decentralized collection with means, quartiles, and 5% and 95% quantiles.

