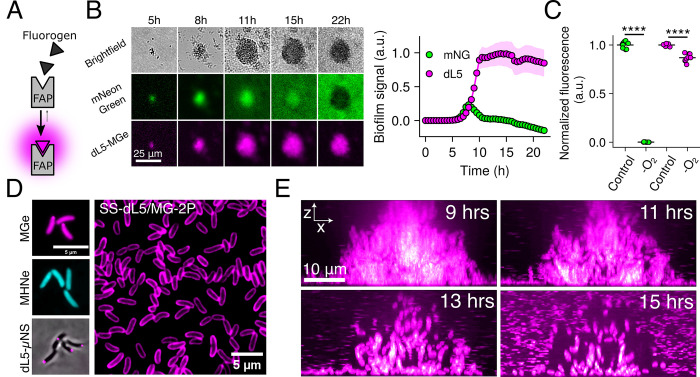
Fig 1. FAPs facilitate long-term imaging of bacterial communities.
(A) Schematic for FAP-fluorogen interaction and initiation of fluorescence signal. (B) Left panel: Images of V. cholerae biofilm growth at low magnification (10× objective) for a strain constitutively expressing a representative fluorescent protein, mNeonGreen, fused to the FAP dL5, grown in the presence of 1 μM MGe and 100 μM norspermidine to stimulate biofilm formation. Right panel: quantification of whole-biofilm fluorescence intensity for the same images. Points represent averages and shaded regions represent standard deviations. N = 4 biological replicates. (C) Final time point bulk culture fluorescence for the same strain as in B grown for 16 h in the presence or absence of oxygen. Fluorescence for each channel is normalized to oxic conditions. N = 3 biological, 3 technical replicates. P = 2.5 × 10⁻¹³ and 4.0 × 10⁻⁶ for mNeonGreen and dL5-MGe, respectively, based on two-sided unpaired t tests relative to the oxic controls. (D) Left panels: Representative images of cells expressing cytoplasmic dL5, labeled with 1 μM MGe (top), 5 μM MHNe (middle), or fused to μNS and labeled with 1 μM MGe (bottom). Right panel: Field of view of cells expressing SS-dL5 labeled with 1 μM MG-2P. (E) Side-on (x-z) view of high-resolution confocal micrographs of V. cholerae biofilm cells expressing SS-dL5 labeled with 1 μM MG-2P over the course of biofilm dispersal. The entire biofilm was optically sectioned for 16 h with 10-min intervals. Images are displayed with a magenta-hot lookup table. a.u., arbitrary units. ****P < 0.0001. Underlying data for this figure can be found on Figshare (https://figshare.com/s/e0978ade2bc95dccf357). FAP, fluorogen-activating protein; MGe, malachite green ester.

