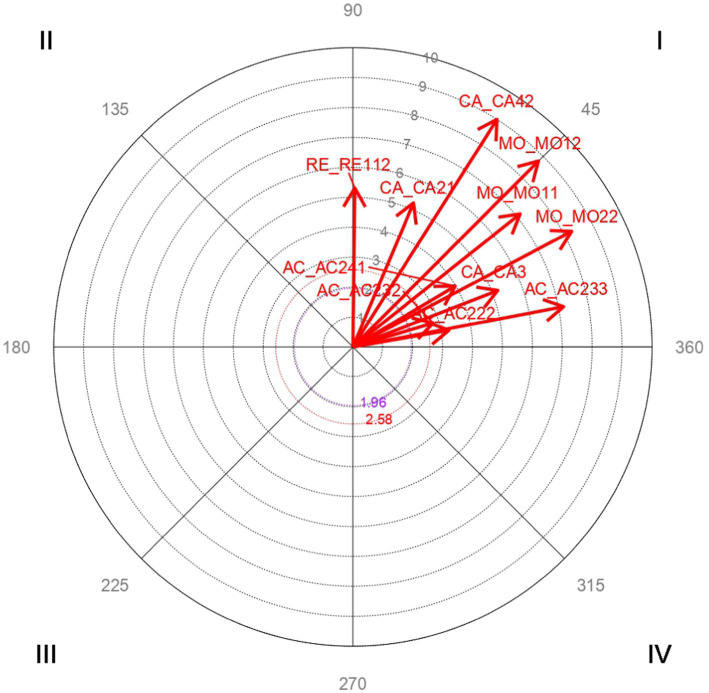
Figure 1.
Analysis of polar coordinate of focal behaviorCA1 organization quadrant I. The vector maps show the relationships between the focal behavior and the rest of the conditioned behaviors. Vectors in quadrant I have a positive prospective and retrospective Zsum. Vectors in quadrant II have a positive retrospective and negative prospective Zsum. Vectors in quadrant III have a negative prospective and retrospective Zsum. Vectors in quadrant IV have a positive prospective Zsum and a negative retrospective Zsum. Significant and highly significant relationship vectors (length > 1.96, p < 0.05 and length > 2.58, p < 0.01, respectively) are plotted.

